Last week, my weekend “think piece” showed that the unadjusted data was not (yet) confirming an economic expansion. This week I shift to Econintersect‘s economic forecast which was published today:
The index is now forecasting a flat growth trend (positive growth, no acceleration) – a welcome change from the positive growth, declining acceleration seen since July 2012.
The question is whether we are at an economic turning point – a good turning point in this case.
For starters, our index does not have accurate vision very far in the future – it is based to a large degree on transport movements. Industry, wholesale, and retail make decisions many months in advance what products need to be purchased. Transport historically is a great pulse point in real time for the economy – and has proven to be valid in the new normal.
But our index has the same defect as any forward looking forecast – history must repeat for our forecast to be valid. In our case, we use alternate data sets and diametrically different methodology as a check on the forecast. Further we validate our forecast against the real economic data when it is issued, and make slight adjustments. To date, there has been only a few small adjustments – and there have been any changed turning points, just the intensity of some of the movements.
We continue to worry that the new normal, with such extraordinary monetary policy, will cause any forecaster to misread their tea leaves – and the prima facia evidence can be found with ECRI or John Hussman’s recession calls.
Econintersect Economic Index (EEI) with a 3 Month Moving Average (red line)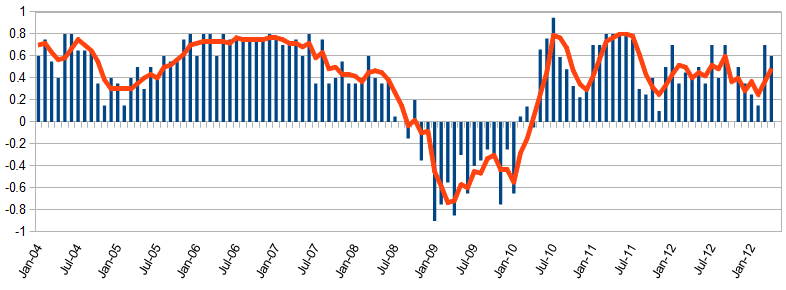
Red line is the three month average which we use in our forecasts – and since it is a 3 month rolling average – a change in direction is a change in the trend growth rate. It is interesting to look at the data from a very small component of our index – rail. Rail has two parts:
- Carloads comprise more crude products.
- Intermodal units are mostly semi-finished and finished products which will be retail sales within a few months.
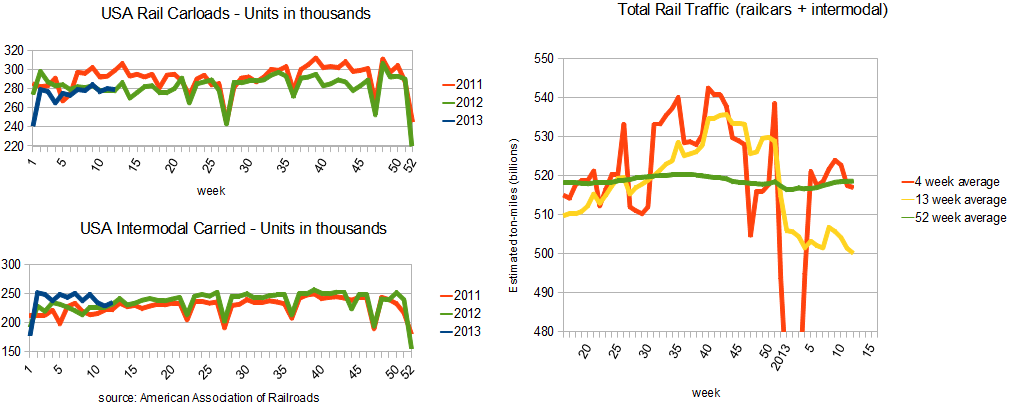
Rail is a good example of the issues in forecasting because it has been effected by a historically unusual situation of declining coal and grain movements. When you start isolating elements and adjusting – at what point do you miss the forest for the trees? Further, the intermodal movements pretty much lead and correlate with the retail sector and has softened in the recent weeks.
Stepping back, rail looks a little nasty. Rail is first reporter of the transport sector – yet our other pulse points are saying something different. The sectors of the economy do not move in unison – and are not fully interrelated or correlated.
There is one other tell-tale item which concerns but is not related directly to GDP (the Wall Street Economy) – namely existing home sales. Econintersect is concerned with a developing trend of a cooling home market. Something is wrong in the consumer segment of the economy. The graph below puts the issue into perspective – where a “less good” home sales trend started in December 2012.
Unadjusted 3 Month Rolling Average of Year-over-Year Growth for Pending Home Sales (blue line) and Existing Home Sales (red line)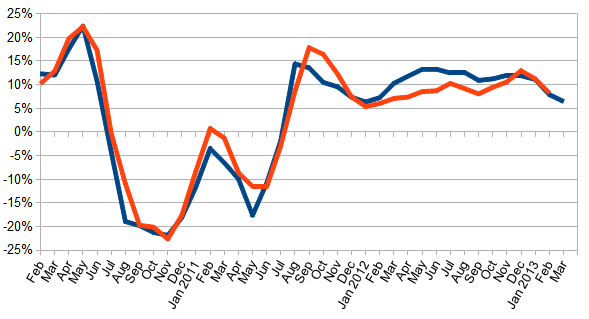
The NAR attributes this cooling trend to lack of inventory – and admittedly low inventory is not helping home sales.
Limited inventory is holding back the market in many areas. Only new home construction can genuinely help relieve the inventory shortage, and housing starts need to rise at least 50 percent from current levels.
If lack of new houses was THE problem, we would expect the supply of new homes to be historically low, but the USA is still on the high side of the inventory levels during normal economic conditions.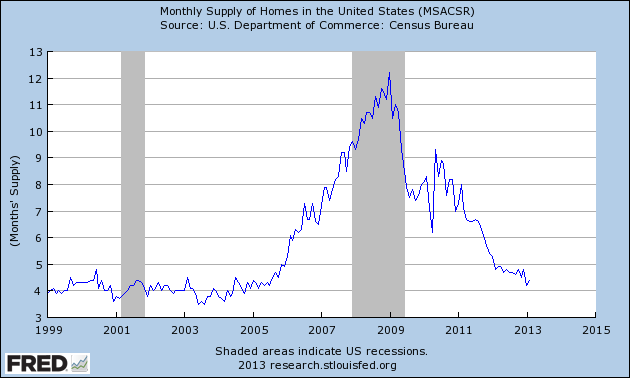
One thing for sure, the economy is NOT strong, and is pulsing as ECRI’s Lakshman Achuthan penned in The U.S. Business Cycle in the Context of the Yo-Yo Years. I would strongly argue that the USA economy is not acting like it has historically. There have always been issues facing the economy which caused worry – but we are continuously reminded that the global financial crisis is NOT behind us – and and because of the global nature, this is a modern phenomena without historical precedent.
I am optimistic that the USA can weather this storm without recessing. But the healing process continues – and it will continue to have a negative impact. The trick for forecasters is to be able to correctly interpret the tea leaves.
Other Economic News this Week:
The Econintersect economic forecast for April 2012 improved marginally, and is now in a zone which says the economy is beginning to grow normally. There are some warning signs that our interpretation is not correct – but we will see how these play out in the coming months. Not to end on a negative note, the majority of pulse points are improving.
The ECRI WLI growth index value has been weakly in positive territory for over four months – but in a noticeable improvement trend. The index is indicating the economy six month from today will be slightly better than it is today.
Current ECRI WLI Growth Index 
Initial unemployment claims rose from 332,000 (reported last week) to 357,000 this week. Historically, claims exceeding 400,000 per week usually occur when employment gains are less than the workforce growth, resulting in an increasing unemployment rate (background here and here).
The real gauge – the 4 week moving average – also worsened from 339,750 (reported last week) to 343,000. Because of the noise (week-to-week movements from abnormal events AND the backward revisions to previous weeks releases), the 4-week average remains the reliable gauge.
Weekly Initial Unemployment Claims – 4 Week Average – Seasonally Adjusted – 2011 (red line), 2012 (green line), 2013 (blue line) 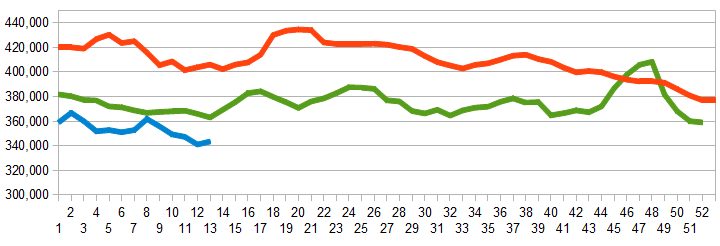
Bankruptcies this Week: Otelco, Revel AC
Data released this week which contained economically intuitive components (forward looking) were:
- Rail movements which are mixed.
- personal income continues to show slower growth than expenditure. this cannot continue indefinitely.
All other data released this week either does not have enough historical correlation to the economy to be considered intuitive, or is simply a coincident indicator to the economy.
Weekly Economic Release Scorecard:
Click here to view the scorecard table below with active hyperlinks
