An interesting article came my way from UBS analyst Julien Garran on the driver for gold. I do not have a link to share so excerpts will have to do.
Garran's article is one of the better one's I have seen. Unlike others, Garran does not cite jewelry, mining capacity, central bank purchases or sales or other similar (and wrong) notions that unfortunately are widespread among most analysts.
Commodities & Mining Q&A (by Julien Garran)
Q1. What drives gold?
A1. In the past, we’ve argued that international US$ liquidity is fundamental to calling first gold and then the industrial miners. In this note, we go a step deeper, arguing that gold is a call on excess returns in the US economy, the policy response and finally the impact on that policy on international US$ liquidity.
Q2. What is gold about to tell us?
A2. The key issues facing gold; excess returns in the US are under pressure as the strong USD and falling energy squeezes cashflow. As wages pressures rise, weak productivity means that cashflows could be squeezed further. Both undermine credit conditions and threaten the longevity of the cycle. We believe the prospect of deteriorating liquidity magnifies the threat. That in turn is limiting the Fed’s ability to tighten policy and may induce it to ease in the future. We think the Fed has started to recognise that pressure with its dovish backtracking at the March meeting last week.
A1&2. In commodity strategy, we believe that a forthcoming rally in gold may warn us that declining returns could ultimately force the Fed into a new round of international reflation. We think the first step was likely the Fed’s dovish backtracking at the March meeting.
In the past, we’ve argued that gold behaves as a probability indicator of whether international US$ liquidity will be improving or deteriorating in six months’ time. Industrial commodities are a call on whether international US$ liquidity is rising now.
So to call gold, and then the industrial miners, we have analysed the key drivers of those flows;
- The Fed
- The US current account deficit
- Bank’s asset buying/accumulation
In this note we go a step deeper – arguing that gold is a call on excess returns in the US economy, the policy response and then finally the impact of that response on international US$ liquidity. We contend that the state of economy wide excess returns ultimately determine the longevity of the cycle, and so it is the progress of excess returns, above the intermediate targets on inflation & unemployment, that ultimately drive monetary policy.
Right now, excess returns are under pressure from four main areas; The rest of the world is exporting deflation to the US.
- The combination of rising wage pressure and low productivity/secular stagnation.
- A potential deterioration in liquidity.
- Deteriorating credit conditions and a rising Wicksell spread.
- Recent papers by Shin and McAuley hint at the reason.
The impact is visible in the deterioration in cashflow & EPS momentum, as well as in low trend US growth.
S&P Cashflow Momentum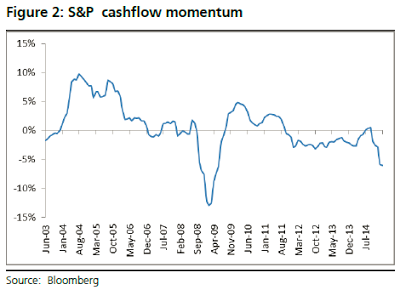
S&P EPS Momentum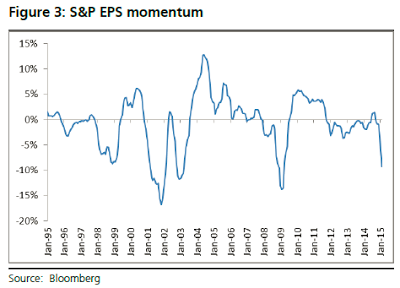
Rest of World exporting deflation to the US
As we’ve highlighted in our last note, international US$ liquidity has collapsed.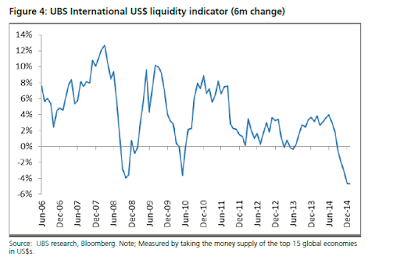
Secular stagnation, weak productivity & wage pressure
The second key threat to US returns comes from low productivity & the dearth of investment, itself induced by the high level of debt and the subsequent low rate of growth (See Buttiglioni – Deleveraging, What deleveraging? 2014).
The UBS house view, consensus and the Fed are all arguing that wages are due to accelerate. The Fed is watching several signs suggesting that labour markets are tightening and that wages are on the cusp of picking-up. Unemployment has fallen, the workweek has risen. Quits, a sign that the jobs market is tight enough to get people quitting work for better opportunities, are trending up.
And the Fed is watching professional wages trend-up. Its mental model is that median wages are attached by elastic to professional wages. When professional wages rise enough, median wages follow. There are clear anecdotal signs this is happening. Walmart (NYSE:WMT) and McDonalds have both announced a buck increase in basic wages in recent weeks. The impact is that labour costs are rising.
In the 90s rising wages promoted an extended cycle. Wages started accelerating in 1994. They accelerated from 1995-8. But cashflow held up. That was because of productivity. Robert Gordon, the godfather of the secular stagnation debate (see ‘Secular Stagnation, 2014 – available free on the Vox website), highlights that total factor productivity rose at a 2.5% rate over the mid-90s. That was partly due to the burgeoning adoption and networking of PCs. And partly it was their increased use managing just in time inventories in a globalising, and lower cost, supply chain.
Of course, conditions are very different today. In ‘Disinflation or deflation?’ January 2015, we argued that deteriorating government productivity, something not measured in the GDP stats, was bringing down productivity for the economy as a whole. The combination of negative net investment and weaker productivity from tech applications means that corporates will struggle to offset rising wages.
US Productivity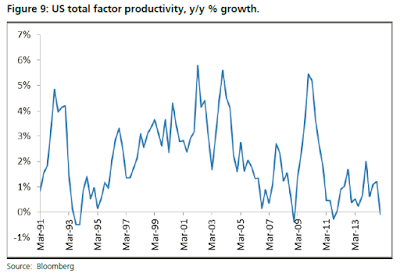
So, in contrast to the extended 90s boom, weak productivity means that, as labour costs rise, cashflow gets squeezed, and credit fundamentals deteriorate further.
Liquidity & Credit Conditions
The most important support for US liquidity is corporate debt issuance for buybacks & M&A. So corporate debt issuance is also a key driver of EPS momentum. From 2010-14, corporates were able to issue large quantities of low quality debt.
In part, this was because there was a huge bid from mutual funds. Persistent Fed, foreign central bank and Investment bank treasury buying over the past five years induced mutual funds to reach for yield. But now that those sources of treasury buying have evaporated, mutual funds have much less incentive to reach for yield – so high yield appetite has deteriorated. Just as the fundamentals of debt, cashflows, are under pressure from the deflationary forces highlighted above.
Transmission Mechanism
The Wicksell spread: The combination of low growth, weak productivity and deteriorating credit conditions put the cycle under increasing pressure. The Wicksell spread is the difference between corporate bond yields and nominal growth. Knutt Wicksell argued that a negative spread (with corporate yields below nominal growth) was like a subsidy to investment. A negative spread was increasingly a tax.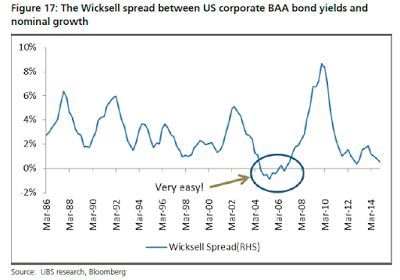
Late Cycle Signals
We have combined both cashflow and separately EPS momentum (giving them a negative sign so deteriorating momentum triggers a rise in the chart) and high yield spreads in our two ‘late cycle’ indicators below. The signals have spiked – suggesting that we are late in the cycle.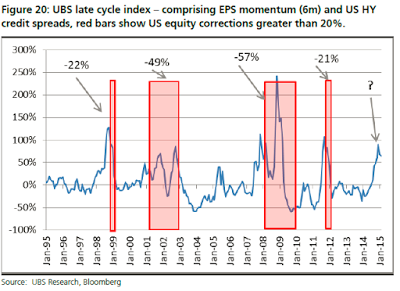
On each previous occasion that we have seen a spike of this magnitude in the indicators, we saw a significant market correction.
Our UBS proprietary Fed action model works on the basis that, over the past 20 years, the Fed has always reflated within two weeks if:
- The S&P fell 20% from peak.
- High yield became stressed (HYG at 85 or below).
So, even though the Fed may focus on the intermediate targets of unemployment and inflation, it is ultimately the underlying sustainability of economy-wide excess returns that forces its hand.
The prospect of a more dovish Fed would set up the potential for a return of international US$ flows. A couple of recent academic papers by Shin & McAuley support the analysis.
Misunderstanding Gold
Garran commentary was excellent, and gratefully devoid of the typical focus on jewelry, mining, central bank purchases, and also manipulation theories.
There is much more in the report, 24 charts in all, of which I posted six. Without explicit permission that is all I am comfortable posting. If I get a link I will add it as an addendum. There were no links in the article to things Garran referenced, so I cannot provide those either.
In case you missed it, please consider my March 27 article Misunderstanding "Peak Gold"; Gold About to Run Out? in which I debunked widely held notions that central bank asset purchases and sales, jewelry, and mining productions as drivers for the price of gold.
Garran's analysis was a welcome refresher from the typical (and wrong) commentary we see about gold.
