What a ridiculous market.
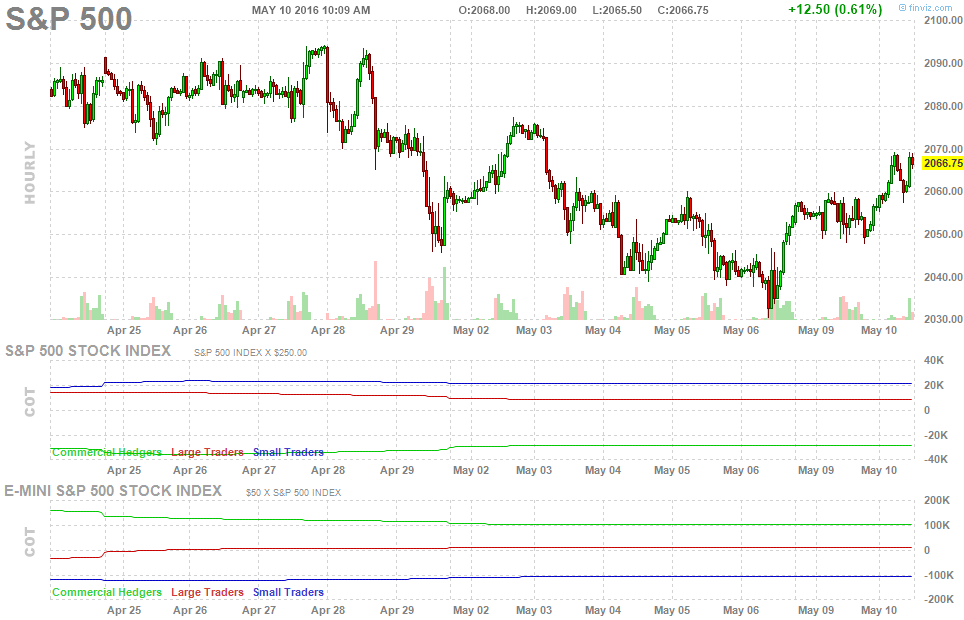
We're right back where we were on April 29th (2,060 on the S&P 500), which is still 2% below the 2,100 line while 3% (2,040) seems to be holding up well so we're consolidating at – you guessed it – the 2.5% line (2,050). This is right where our 5% Rule™ expects us to be and we haven't broken down yet – but that doesn't mean we're not going to, so we're still loving our hedges, which are keeping our portfolios fairly neutral in all this chop.
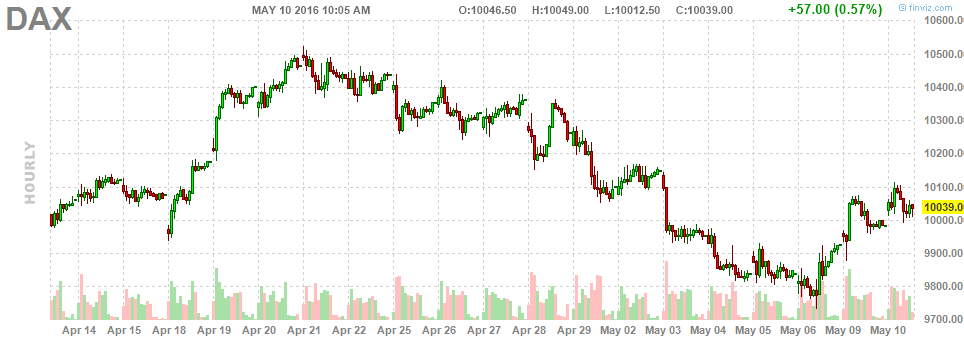
Similarly, the DAX fell from 10,500 to 9,800, which is -6.66% (thanks Lloyd!) and, as we know from the 5% Rule™, that's an overshoot and we expect a 20% (150 points) weak bounce to 10,650 or a 40% (300 points) strong bounce to 10,100 and we're not going to be impressed by the "recovery" until the 10,100 line is held for more than a day and a rejection at 10,100 would be a bad sign:
See, isn't that easy? The Must Hold line on the DAX is 11,000 (same as the NYSE) so 10,450 is the true 5% drop so we're really not impressed, in the bigger picture, until the DAX is over 10,500 so 10,100 should be EASY to pop back over if they are really on the way back to 10,500 and, if the DAX can't get back to it's -5% line, why would we be bullish on the S&P where 5% off the top (2,100) is 1,995 when it's already over that?
TA should follow your bullish investing premise, in the very least. The bullish story is that the US is recovering (it is, slowly) and Europe is recovering and Asia will muddle through but if Europe's top index is 5% below it's Must Hold line (2,050 is 11% over the S&P's Must Hold at 1,850), how is the S&P going to justify being 20% higher than our German cousins? Don't we all pretty much sell our goods and services on the same planet?
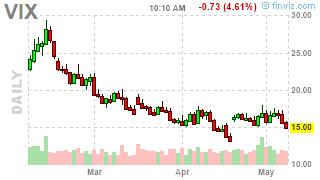
Amazingly, for all these wild market swings, volatility is very low – almost half of where it was in February, when the S&P tested our Must Hold line at 1,850 and actually touched 1,800 before turning back around – scary… What I find even more scary is how investors get so complacent when we're near the highs. They know how to panic at the lows – it's the highs that seem to confuse them because they get stuck in BUYBUYBUY mode, no matter how expensive things get.
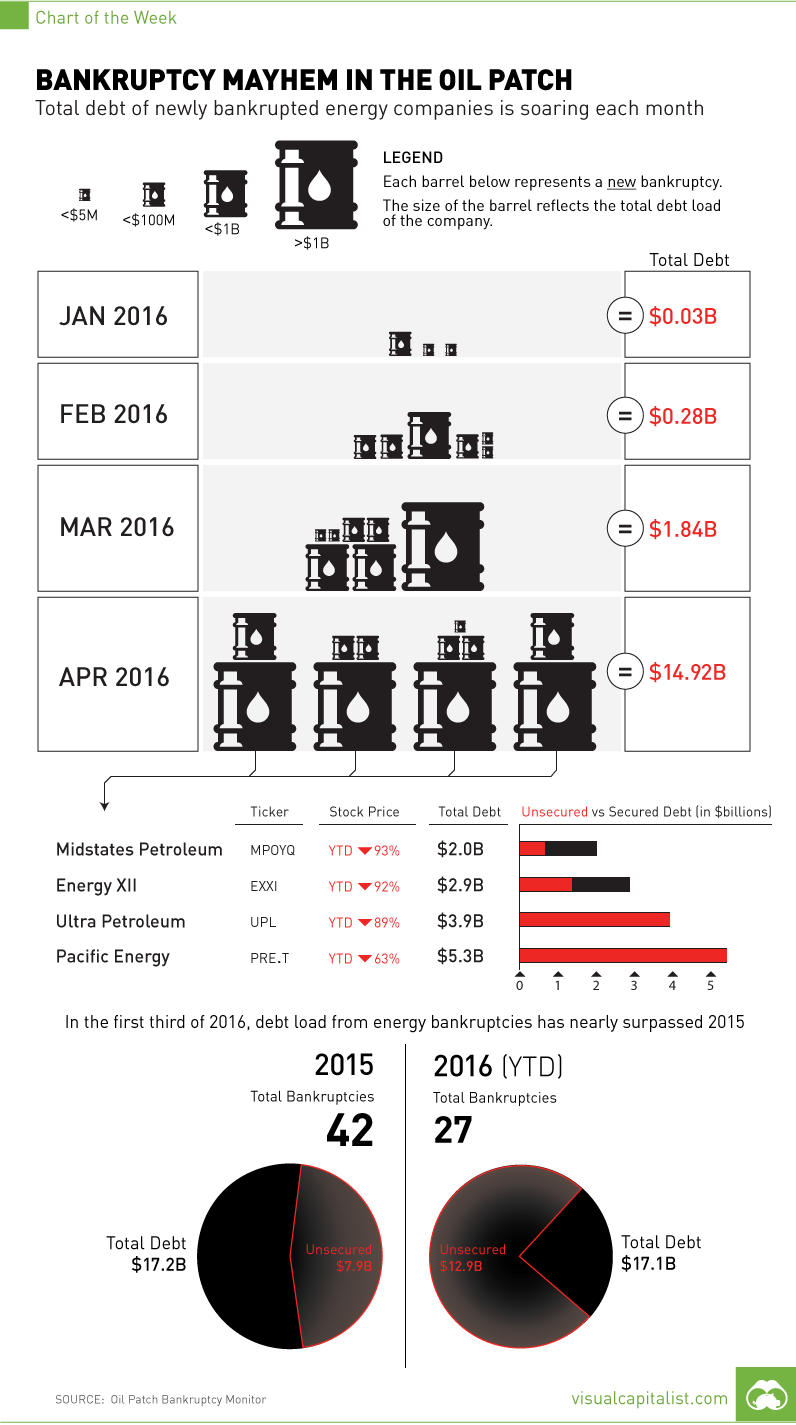
Speaking of things that get expensive – does it matter when $15Bn worth of debt is defaulted on in one sector in one quarter? That's where we are in the oil patch, with 27 bankruptcies through April.

Notice the pace is picking up and, so far, these are small potatoes compared to companies like Pacific Energy (PEA), who are restructuring their $5Bn of debt and Ultra Petroleum Corp (NYSE:UPL), who just got de-listed with their $4Bn debt – but technically not bankrupt yet. Energy XXI Ltd (SG:EXXI) and Midstates Petroleum Company Inc (OTC:MPOYQ) are struggling with $3Bn and $2Bn respectively and Energy XII operates 10 of the biggest oil fields in the Gulf.
Interestingly, bankruptcies help to keep the cost of oil low as EXXI is forced to sell (for example) $5Bn worth of assets for $2Bn to partially pay off creditors and bye bye EXXI and hello lucky company who have a break-even of $20 vs EXII's $50 on the same wells. This is what the clueless pundits tend to get wrong – the assets don't disappear – just the money!
So pity the poor Banksters, they are the real victims here. Well, them and the shareholders of EXXI et al, of course. This is why we stay away from oil minors and, of course, the winners are, as always, the majors, who are always there to scoop up the bargains.
That's why we're bullish on oil through July only and not expecting much more than $55, after which we'll likely be bearish again as these bankruptcies flow through and new owners put cheaper production back on-line. So there's an ebb and flow to the game the Saudis are playing in this fight for market share. At the moment, they have the upper hand but, like any game – the lead goes back and forth and those who are able to step back and look at the bigger picture can profit from it.
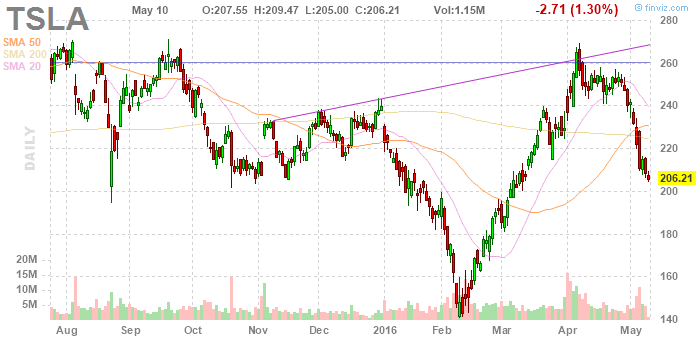
Meanwhile, speaking of peak demand, poor Tesla (NASDAQ:TSLA) is having trouble fooling all of the people all of the time as people are catching on to my premise ($50 later) that Emperor Musk has not clothes or, more accurately, no possibility of producing 500,000 cars in 2018. Read my post if you want the logic and math but, really, they barely made 50,000 cars last year after 10 years of trying so you have to clap your hands really hard to believe they can ramp up production 10x in just two more years.
Now Morgan Stanley (NYSE:MS), a former TSLA cheerleader (because they underwrite their capital raises) is too embarrassed to peddle Musk's snake oil with Adam Jonas saying:
“Our delivery estimates are largely unchanged,” Jonas and two fellow analysts wrote in a note to investors. “By 2018, we forecast ~108k units, well below the updated target of 500k.”
JPMorgan (NYSE:JPM) analyst Ryan Brinkman has said he does “not believe Tesla will be able to achieve 500,000 units.” UBS AG analyst Colin Langan called Musk’s plan “too aggressive.” Tesla stock fell more than 3% on Monday and flatlined under $210 yesterday. Our trade idea for TSLA back on April 5th was:
- Sell 10 June $270 calls for $13.20 ($13,200)
- Buy 10 June $275 puts for $35.70 ($35,700)
- Sell 10 June $250 puts for $20.70 ($20,700)
That spread had a net cash outlay of $1,800 with another $20,000 of margin on the short calls. The puts have already fallen to $1.30 ($1,300) and the spread is far in the money at net $24 ($24,000) for net $22,700 and that can be closed today (one month later) for a 1,260% return on cash and over 100% back on cash and margin in just 35 days – nice work if you can get it!

