Turning Points For The Upcoming Week Of July 8-12Summary
- Riskier credits are still trading at very liquid levels.
- Leading indicators have stabilized at high levels.
- Most coincidental indicators are still rising. While industrial production is decreasing, it acted in a similar manner during the 2014-2016 slowdown and no recession occurred.
The purpose of the Turning Points Newsletter is to look at the long-leading, leading, and coincidental indicators to determine if the economic trajectory has changed from expansion to contraction - to determine if the economy has reached a "Turning Point."
This week's column is a thought experiment. Regular readers know that I believe there is a 20% recession probability in the next 6-12 months and that I also believe we're at the end of an economic cycle. I'm therefore far more likely to read data bearishly. This week I'm going to take the opposite approach and argue that while recent data is softer, it's still strong enough to argue that the economy will continue to grow. This idea came from a recent speech by Cleveland Fed President Loretta Mester, in which she observed:
On the other hand, throughout this expansion, the U.S. economy has proven itself resilient to a variety of economic shocks, headwinds, and uncertainties. We have seen similar episodes of soft data and sentiment that subsequently reversed.
The BIS recently made the same observation. This column regularly focuses on quantifiable data which does not take into effect the inherent resiliency of market economy participants, whose profit-maximizing incentivization gives them a high degree of resiliency to challenging economic times. It is those traits that Mester and the BIS are highlighting.
Long-Leading Indicators
While the yield-curve inversion has increased the probability of a recession, lower-rated credit spreads are still low, relatively speaking.
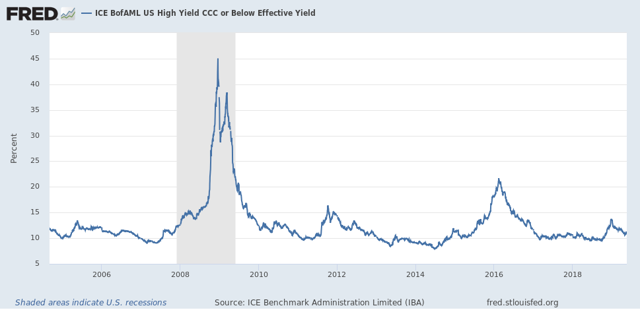
Junk bond yields blew out during the recession, at one time hitting 45%. In retrospect, this can be viewed as an extreme, once-in-a-lifetime event. CCC yields widened during the oil market drop in 2014-2016; yields rose slightly above 20%. Here's a chart of the last five years:
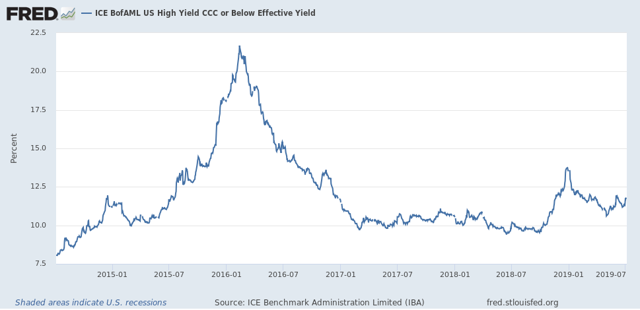
While yields rose to 13.5% at the beginning of this year, they have since come in and are below 12.5% - a very liquid level for the junk market.
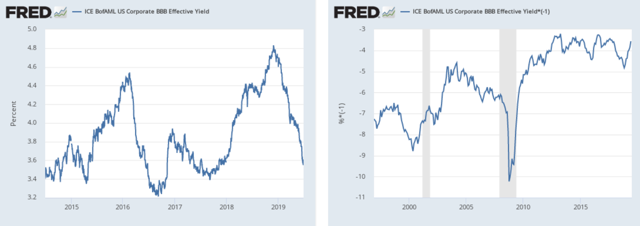
BBB yields are also at very liquid levels. The left chart shows that BBB yields have dropped slightly more than 120 basis points since the start of the year. The right is longer (about 20 years). It shows the BBB yield multiplied by -1. Currently, yields are very liquid by historical standards.
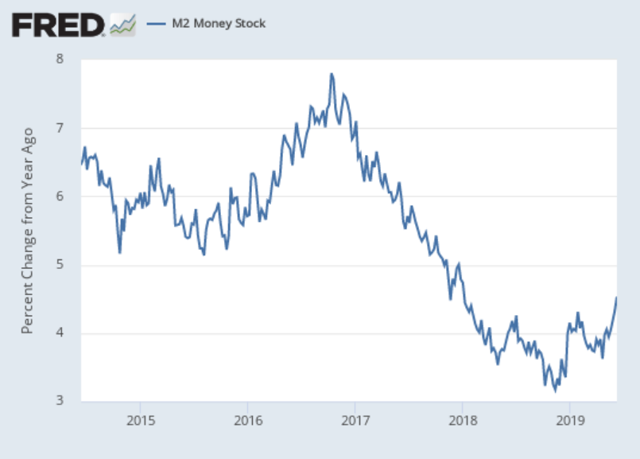
Finally, the money supply has recently started to increase, providing additional fuel for the economy.
Leading Indicators
While orders for key durable goods sectors are no longer moving higher, they have stabilized at high levels:
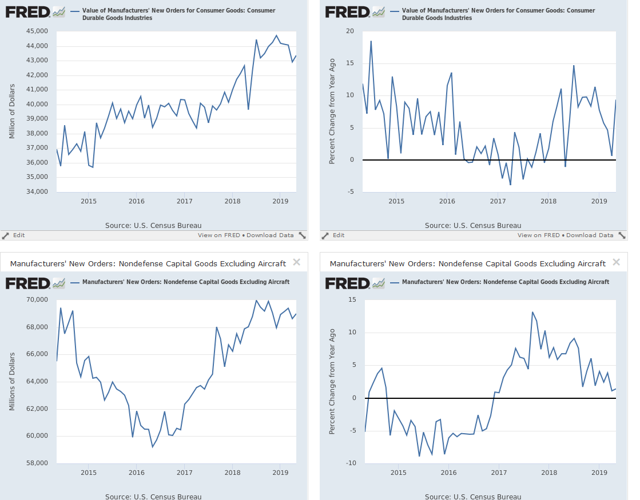
The top two charts show new orders for consumer durable goods (left is absolute value; the right is the Y/Y percentage change). While the data has trended lower for the last few months, it remains at a high level. We can make the same observation for non-defense orders for capital goods (the bottom two charts). It would be more bearish if either or both of these data sets had moved lower. The fact the data is still at high levels indicates activity has stabilized at high levels.
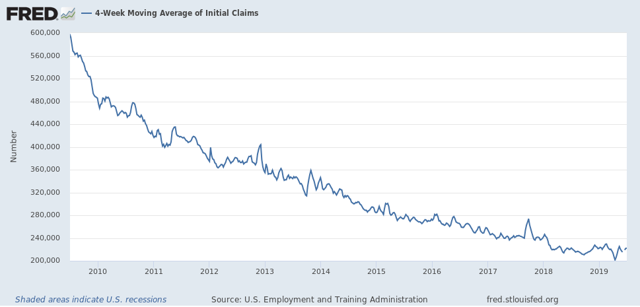
The four-week moving average has bottomed but has yet to move higher. Much like the durable goods data, this metric has stabilized at a bullish level.
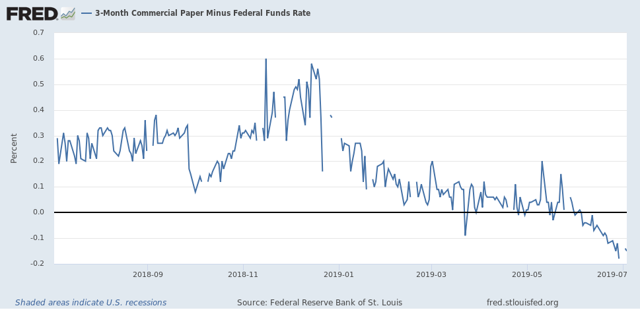
Commercial paper is trading at negative levels relative to comparable Treasuries. The short-term funding market is very liquid.
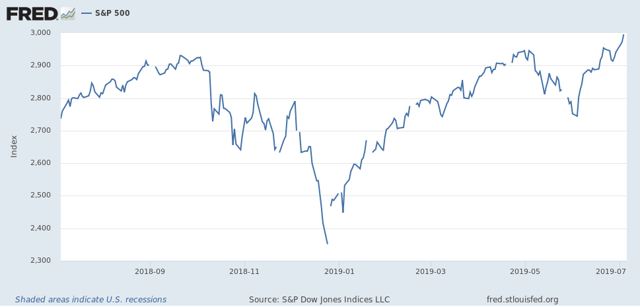
The stock market recently hit a new high, indicating confidence in the next 6-12 months of economic activity.
There's a great deal to like in the leading indicators data. While I have argued we should pay attention to the data's recent softness, bulls could argue there is plenty to support a continued expansion case.
Coincidental Data
Three of the four coincidental indicators continue to increase.
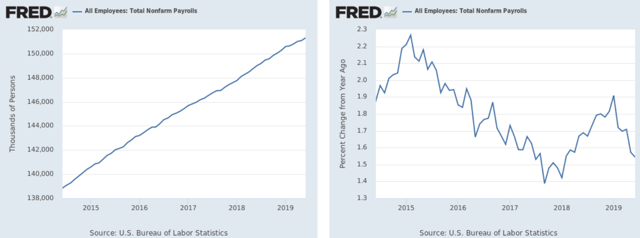
Payroll employment growth continues at strong rates.
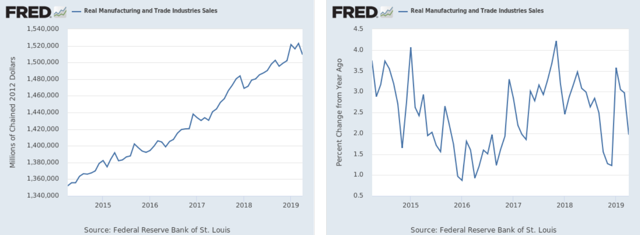
Manufacturing and trade industry sales are growing.
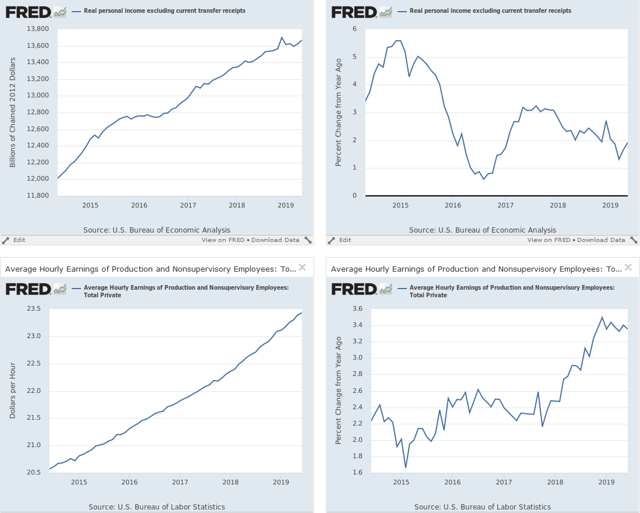
Incomes are growing.
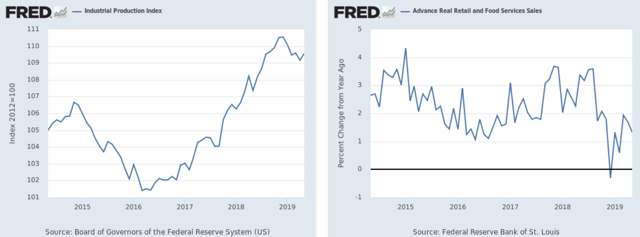
Industrial production is the one weak spot in the data. But remember that this indicator also decreased from late 2014 to early 2016 and the economy continued to expand at a modest pace.
In short, there is plenty of data to argue that the economy is experiencing softer growth but that - as with the 2014-2016 slowdown - there is little reason to think we'll have a recession.
