
Size matters in the media business as much or more than almost any other sector. As one of the largest media companies in the world, Viacom Inc.’s (VIAB) distribution and reach puts the company in a very strong competitive position.
Nevertheless, the market greatly undervalues the cash flows of the company. To be specific, the current value of the stock (~$50/share) implies the company’s after-tax cash flow (NOPAT) will permanently decline by nearly 25%.
Market Expectations
In other words, the market is predicting that Viacom’s cash flows will take a major dive and never recover. Figure 1 plots a comparison of the stock to its economic book value, which is currently $66/share. This is the value of the stock if Viacom’s NOPAT never grows beyond its 2012 level.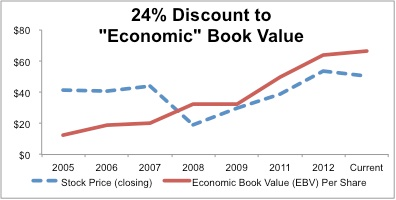
Sources: New Constructs, LLC and company filings
Bears will point to the company’s recent disappointment in fourth quarter revenues. Total revenue of $3,363 million in 4Q2012 dropped 17% versus 2012. That is a big drop to be sure, but earnings still rose by over 14% over the same period.
Focus On Profits
Rising earnings despite a rather large drop in revenues suggests the company is focusing its business more on the profitable segments (affiliates) than the unprofitable segments (movies). By focusing more on scaling their existing brands into new markets as well as investing more in digital content and distribution, Viacom’s future cash flow prospects look great to me.
The merits of this strategy are proven by the rising trend in the company’s return on invested capital (ROIC). This impressive trend shows the company is becoming more profitable not less profitable as the market suggests. Figure 2 plots VIAB’s ROIC versus its weighted average cost of capital (WACC) over the past seven fiscal years.
VIAB’s 2012 ROIC was 14% compared to just 2% for Time Warner, Inc. (TWX) and 10% for Disney (DIS). Neither TWX nor DIS have achieved as strong or consistent an ROIC as VIAB over the last several years. And both of those stocks are much more expensive than VIAB.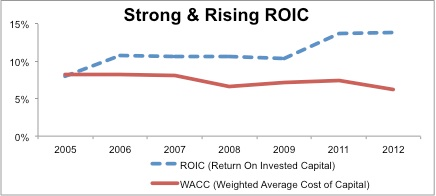
Sources: New Constructs, LLC and company filings
If one looks only at the reported earnings of the company in 2012, one sees a decline in earnings. On the other hand, assessment of the company’s economic earnings shows an increase. Figure 3 compares the company’s 2012 GAAP earnings to is economic earnings.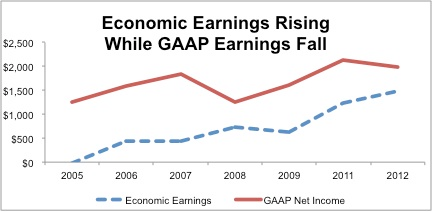
The primary difference in GAAP and economic earnings for VIAB in 2012 is the removal of non-operating items dug out from the footnotes and MD&A as well as a normalization adjustment to the company’s reported taxes. The take away is that doing a little extra digging reveals a company whose profits are on the rise and not likely to fall the nearly 25% that is implied by the stock’s valuation.
Insider Buys
I get the strong sense that management agrees with my thesis and is putting its money where its mouth is. Over the last two years, the company has repurchased 121 million shares or 20% of outstanding shares. In 2012 alone, it bought back approximately $3.4 billion of stock or about 14% of the company’s total market cap.
For fiscal year 2013, the company plans to repurchase roughly the same amount as 2012. Combined with a dividend yield of 2.2%, the repurchase program offers a 16%+ return to equity holders. Not bad.
If nothing else, the dividend yield and buyback commitment put a strong bottom on the stock. Or as I see things, they add significant upside to what is already a very undervalued stock.
Risk And Reward
VIAB gets my Very Attractive rating because of its rising profitability and cheap valuation. The risk/reward of this stock is also compelling because of its 2.2% dividend and management’s buyback program.
My regular readers know that I also cover 400+ ETFs and 7000+ mutual funds, and I like to point out the ETFs and mutual funds that allocate most to the stocks I recommend to buy or sell.
For VIAB, there is only one mutual fund (and zero ETFs) that allocates significantly to VIAB and gets an Attractive or better rating: Managers AMG Funds: Yacktman Fund (YACKX). This finding is not too surprising given that the Telecom Sector ranks eighth out of ten sectors per my Sector Rankings for ETFs and Mutual Funds report. There are simply not many good Telecom ETF or mutual funds. You can access all of my sector reports here.
Disclosure: I do not currently own VIAB. I receive no compensation to write about any specific stock or theme.
- English (UK)
- English (India)
- English (Canada)
- English (Australia)
- English (South Africa)
- English (Philippines)
- English (Nigeria)
- Deutsch
- Español (España)
- Español (México)
- Français
- Italiano
- Nederlands
- Português (Portugal)
- Polski
- Português (Brasil)
- Русский
- Türkçe
- العربية
- Ελληνικά
- Svenska
- Suomi
- עברית
- 日本語
- 한국어
- 简体中文
- 繁體中文
- Bahasa Indonesia
- Bahasa Melayu
- ไทย
- Tiếng Việt
- हिंदी
Tune Into Viacom’s Stock
Published 11/27/2012, 03:57 PM
Updated 07/09/2023, 06:31 AM
Tune Into Viacom’s Stock
3rd party Ad. Not an offer or recommendation by Investing.com. See disclosure here or
remove ads
.
Latest comments
Install Our App
Risk Disclosure: Trading in financial instruments and/or cryptocurrencies involves high risks including the risk of losing some, or all, of your investment amount, and may not be suitable for all investors. Prices of cryptocurrencies are extremely volatile and may be affected by external factors such as financial, regulatory or political events. Trading on margin increases the financial risks.
Before deciding to trade in financial instrument or cryptocurrencies you should be fully informed of the risks and costs associated with trading the financial markets, carefully consider your investment objectives, level of experience, and risk appetite, and seek professional advice where needed.
Fusion Media would like to remind you that the data contained in this website is not necessarily real-time nor accurate. The data and prices on the website are not necessarily provided by any market or exchange, but may be provided by market makers, and so prices may not be accurate and may differ from the actual price at any given market, meaning prices are indicative and not appropriate for trading purposes. Fusion Media and any provider of the data contained in this website will not accept liability for any loss or damage as a result of your trading, or your reliance on the information contained within this website.
It is prohibited to use, store, reproduce, display, modify, transmit or distribute the data contained in this website without the explicit prior written permission of Fusion Media and/or the data provider. All intellectual property rights are reserved by the providers and/or the exchange providing the data contained in this website.
Fusion Media may be compensated by the advertisers that appear on the website, based on your interaction with the advertisements or advertisers.
© 2007-2024 - Fusion Media Limited. All Rights Reserved.