This is what professionals call a WTH market (the "H" stands for heck).
Markets undergoing vast changes in their technical outlook on a minute to minute basis are best described as WTH markets. I have no doubt that investors who have been trained, and thus far rewarded, to "buy the dip" were putting money to work early this morning as the S&P 500 screamed higher, but I also have no doubt they are now remorseful buyers.
The market looked equally as horrible on the close as it looked fantastic on the open. In such markets, typical market analysis techniques simply don't work and traders attempting to chase prices back and forth will wish they had never heard of momentum indicators.
In the past, WTH markets have been followed by big moves so traders should approach the S&P with more caution than usual.

Bonds and notes will eventually be a better buy than they are a sell but we aren't convinced the lows are in yet.
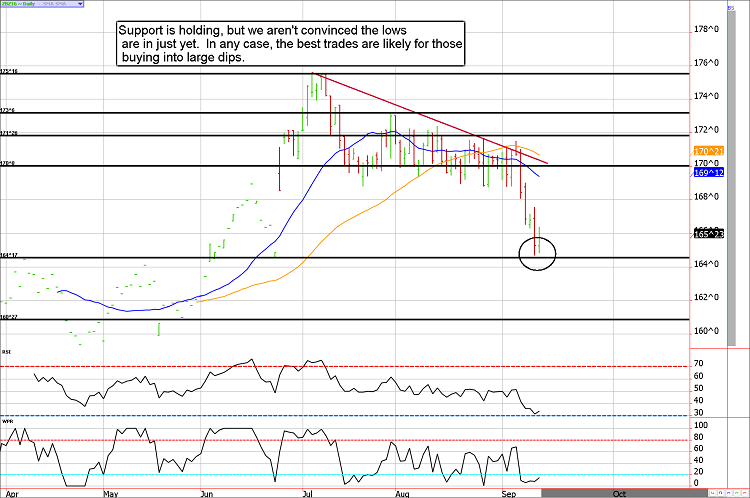
The 30-year bond and the 10-year note have bounced from oversold levels but today's upswing didn't feel like a trend change. Instead, it felt like a tepid retracement before a bigger move lower. Of course, there is plenty of event risk interfering with chart analysis (such as next week's Federal Reserve meeting), but we wouldn't be too eager to get bullish from these levels despite support in the 30-year bond holding.
We see the possibility of the 30-year Treasury futures contract printing near 161 before traders step in aggressively. This would be equivalent to just under 129 in the 10-year note.
Treasury Futures Market Analysis
**Bond Futures Market Consensus:** The note will probably need to "catch up". Look for a possible move to about 161 in the ZB and just under 129 in the ZN.
**Technical Support:** ZB : 164'17 and 160'27 ZN: 129'14 and 128'23
**Technical Resistance:** ZB: 170, 171'26, 173'06, and 175'16 ZN: 131'03, 132'02, and 133'14

The triple witch will be tricky
*You should be trading the December contract going forward!
On most quarterly expirations, the market squeezes higher into expiration of the futures contract on Friday morning. However, as the September futures contract is nearing its last trading session (tomorrow, because it expires Friday morning) it feels like we will see the opposite...a long squeeze.
In the past, the third quarter expiration has been tricky; although more often than not the September triple witch has been bullish, those occasions in which the bears took control were pretty ugly; this is particularly true in the late 1990s and early 2000's. For example, the Dow dropped over 1,300 points during expiration week in 2001.
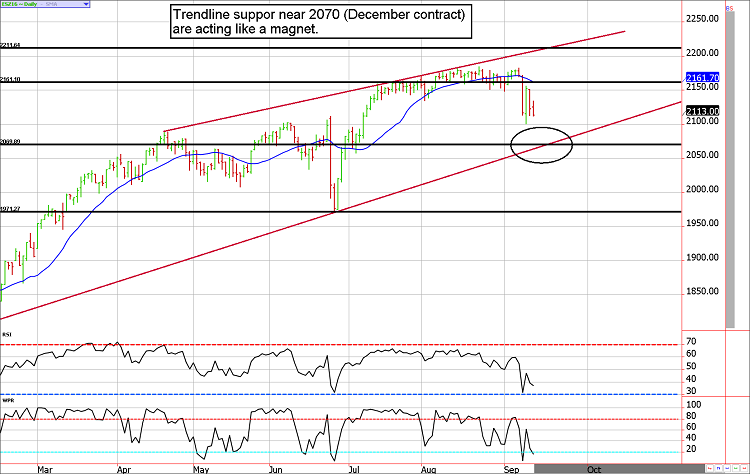
If we are right about an expiration sell-off, this could bring the December e-mini S&P to 2070 in the coming days. If we are wrong about this occurring by Friday, it would likely be in the cards for next week which has historically been overwhelmingly weak for the stock market.
Stock Index Futures Market Ideas
**e-mini S&P Futures Market Consensus:**
Our best idea would be to get temporarily bullish with swing trades should the ES fall into the 2070 area.
These are based on the December contract!
**Technical Support:** 2102, 2070 and 1972
**Technical Resistance:** 2161 and 2211
e-mini S&P Futures Day Trading Ideas
**These are counter-trend entry ideas, the more distant the level the more reliable but the less likely to get filled**
ES Day Trade Sell Levels: December contract: 2133, 2157, and 2170
ES Day Trade Buy Levels: December contract: 2110, 2100, 2082, and 2070
In other commodity futures and options markets....
June 23 - Go long corn futures near 392 using mini contracts (the beginning of a scale trade). Full-sized contracts can be used if available margin and risk tolerance is appropriate.
June 30 - Buy September mini (or full-sized) wheat near $4.47.
July 5 - Add to the long mini corn (or full sized) near $3.45.
July 14 - Sell the corn add-on near 370 to lock in a profit (hold the original entry).
July 14 - Add to the short ES call trade by selling a September 2235 call for about 10.000 in premium.
July 29 - Buy back September ES 2235 call to lock in gain.
July 29 - Buy mini corn future near $3.33 to average entry cost lower.
July 29 - Buy mini wheat to add to our long and adjust the average position entry to $4.25ish.
August 18 - Sell half of the mini wheat position to lock in a profit of about 20 cents on the add-on contract. We'll hold the original position in hopes of a continued upswing.
August 18 - Sell November crude oil 56 call for about 50 cents ($500).
August 25 - Buy back crude oil 56 call to lock in a quick profit (roughly $230 to 280 per contract depending on fill prices).
August 25 - Buy back the ES 2200 call to lock in moderate gain ahead of Yellen's speech.
August 29 - Sell December live cattle 99 put for about 140 (or $560).
September 14 - Buy the January soybeans 10.60 calls for about $300.
(Our clients receive short option trading ideas in other markets such as gold, crude oil, corn, soybeans, euro, yen, and more. Email us for more information)v
Disclaimer: **There is substantial risk of loss in trading futures and options.** These recommendations are a solicitation for entering into derivatives transactions. All known news and events have already been factored into the price of the underlying derivatives discussed. From time to time persons affiliated with Zaner, or its associated companies, may have positions in recommended and other derivatives. Past performance is not indicative of future results. The information and data in this report were obtained from sources considered reliable. Their accuracy or completeness is not guaranteed. Any decision to purchase or sell as a result of the opinions expressed in this report will be the full responsibility of the person authorizing such transaction. Seasonal tendencies are a composite of some of the more consistent commodity futures seasonals that have occurred over the past 15 or more years. There are usually underlying, fundamental circumstances that occur annually that tend to cause the futures markets to react in a similar directional manner during a certain calendar year. While seasonal trends may potentially impact supply and demand in certain commodities, seasonal aspects of supply and demand have been factored into futures & options market pricing. Even if a seasonal tendency occurs in the future, it may not result in a profitable transaction as fees and the timing of the entry and liquidation may impact on the results. No representation is being made that any account has in the past, or will in the future, achieve profits using these recommendations. No representation is being made that price patterns will recur in the future.
