Trina Solar Limited (TSL) is an integrated solar-power products manufacturer based in China with a global distribution network covering Europe, North America and Asia. The Company produces standard monocrystalline photovoltaic (PV) modules ranging from 165 Watts to 185 Watts in power output and multicrystalline PV modules ranging from 215 Watts to 240 Watts in power output. Trina sells and markets its products worldwide, including in a number of European countries, such as Germany, Spain and Italy.
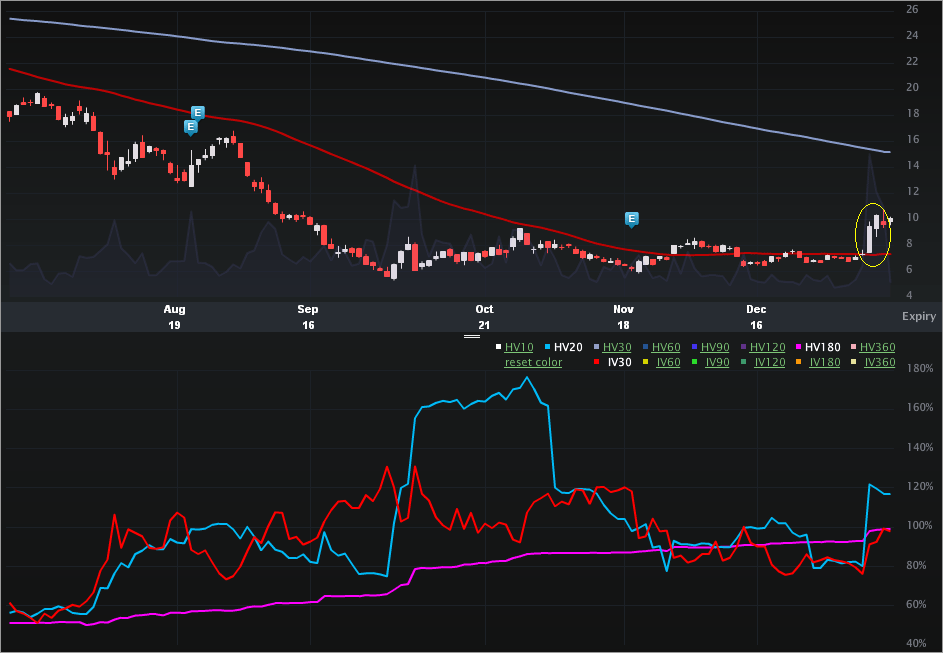
While the stock is trading over $10 today, this was a $7 stock just a few days ago. Let’s look to the Charts Tab (six months), below. The top portion is the stock price, the bottom is the vol (IV30™ - red vs HV20 - blue vs HV180 - pink).
On the stock side, I’ve highlighted the recent pop. Also note the equity price meltdown over the last six months. In fact, the annual high for TSL is $31.08, reflecting the horrific performance of solar in general over the last year. The news that popped the stock recently surrounds some component price stability. Here’s a snippet from a news article from Reuters:
Solar stocks rallied sharply on Wednesday, regaining some of the ground lost during last year's steep sell-off, on signs that prices for solar energy components were stabilizing.
Chinese solar companies Hanwha SolarOne Co Ltd (HSOL.O), JinkoSolar Holding Co (JKS.N), JA Solar Holdings Co Ltd (JASO.O), Trina Solar Ltd (TSL.N), Suntech Power Holdings Co Ltd (STP.N) and Yingli Green Energy Holding Co Ltd (YGE.N) led the jump, with gains of 23 to 41 percent.
Most solar stocks had plummeted more than 60 percent last year as prices for the panels that turn sunlight into electricity fell sharply, cutting profit margins for the companies that manufacture them.
Investors on Wednesday, however, cheered figures showing a dramatic rise in new solar installations in Germany in the fourth quarter and higher prices on the industry's key raw material, polysilicon.
Source: Reuters via Yahoo! Finance. Solar stocks soar on strong Germany, improved prices. Reporting by Matt Daily in New York and Nichola Groom in Los Angeles; Editing by Gerald E. McCormick, Gunna Dickson; Editing by Richard Chang
That news pushed TSL from $7.30 on 1-10-2012 to $9.43 the next day, or 29.2%. All told, TSL stock has popped from $7.08 to now over $10 in less than five trading days -- a 41.8% rise.
Let’s turn to the Skew Tab, below, to examine the month-to-month and line-by-line vols.
We can see a monotonic increase in vol from the back to the front, with the Jan expiry substantially elevated to both of the back months. My best guess is that the next earnings cycle for TSL will be in late Feb, likely (or possibly) after Feb expiry. In English, the next earnings cycle should be in the Mar options. As of right now, the Mar options are priced below the front two months (with respect to vol). Hmm…
Let’s turn to the Options Tab for completeness.
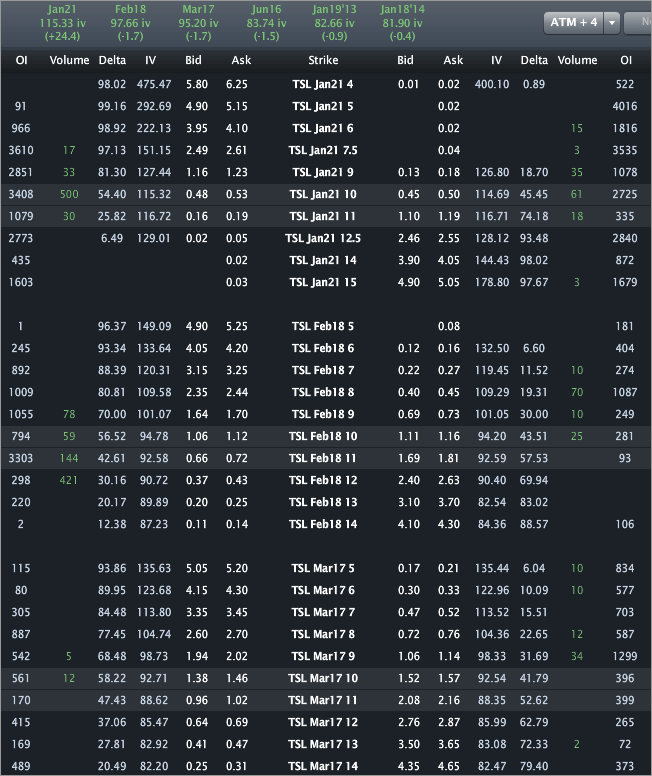
I wrote about this one for TheStreet, so no specific trade analysis here. We can see the front three expiries are priced to 115.33%, 97.66% and 95.20% for Jan, Feb and Mar, respectively. It’s important to keep in mind that Chinese stocks do hold a systematic risk associated with a less than transparent reporting body – aka the Chinese government. Further, there is a firm specific risk of rather large proportions as it’s not terribly uncommon for fraud allegations to rise and halt the stocks – potentially for several months.
Having said that, it’s the depressed Mar vol relative to the front months that caught my attention along with the rally in the industry on a broad scale and TSL stock more specifically.
This is trade analysis, not a recommendation.
- English (UK)
- English (India)
- English (Canada)
- English (Australia)
- English (South Africa)
- English (Philippines)
- English (Nigeria)
- Deutsch
- Español (España)
- Español (México)
- Français
- Italiano
- Nederlands
- Português (Portugal)
- Polski
- Português (Brasil)
- Русский
- Türkçe
- العربية
- Ελληνικά
- Svenska
- Suomi
- עברית
- 日本語
- 한국어
- 简体中文
- 繁體中文
- Bahasa Indonesia
- Bahasa Melayu
- ไทย
- Tiếng Việt
- हिंदी
Trina Solar - Industry Pop, Firm Specific Risk, Earnings Vol
Published 01/18/2012, 01:51 AM
Updated 07/09/2023, 06:31 AM
Trina Solar - Industry Pop, Firm Specific Risk, Earnings Vol
Latest comments
Loading next article…
Install Our App
Risk Disclosure: Trading in financial instruments and/or cryptocurrencies involves high risks including the risk of losing some, or all, of your investment amount, and may not be suitable for all investors. Prices of cryptocurrencies are extremely volatile and may be affected by external factors such as financial, regulatory or political events. Trading on margin increases the financial risks.
Before deciding to trade in financial instrument or cryptocurrencies you should be fully informed of the risks and costs associated with trading the financial markets, carefully consider your investment objectives, level of experience, and risk appetite, and seek professional advice where needed.
Fusion Media would like to remind you that the data contained in this website is not necessarily real-time nor accurate. The data and prices on the website are not necessarily provided by any market or exchange, but may be provided by market makers, and so prices may not be accurate and may differ from the actual price at any given market, meaning prices are indicative and not appropriate for trading purposes. Fusion Media and any provider of the data contained in this website will not accept liability for any loss or damage as a result of your trading, or your reliance on the information contained within this website.
It is prohibited to use, store, reproduce, display, modify, transmit or distribute the data contained in this website without the explicit prior written permission of Fusion Media and/or the data provider. All intellectual property rights are reserved by the providers and/or the exchange providing the data contained in this website.
Fusion Media may be compensated by the advertisers that appear on the website, based on your interaction with the advertisements or advertisers.
© 2007-2024 - Fusion Media Limited. All Rights Reserved.
