
This is the latest performance update on my long-short account based on my Trend Model signals (see An intriguing Trend Model interim report card). The Trend Model account had another solid month as it returned 3.0% for November; the one-year return was 38.1%; and the return from inception of September 30, 2013 was 38.5%.
I reiterate my disclaimer that I have nothing to sell anyone right now. I am not currently in a position to manage anyone`s money based on the investment strategy that I am describing.
Trend Model description
For readers who are unfamiliar with my Trend Model, it is a market timing, or asset allocation, model which uses trend following techniques as applied to commodity and global stock market prices to generates a composite Risk-On/Risk-Off signal (risk-on, risk-off or neutral). I have begun updating readers on the Trend Model signals on a weekly basis (for the last weekly comment, see Trust (the bull), but verify (the trend)) and via Twitter (@humblestudent) as new developments occur.
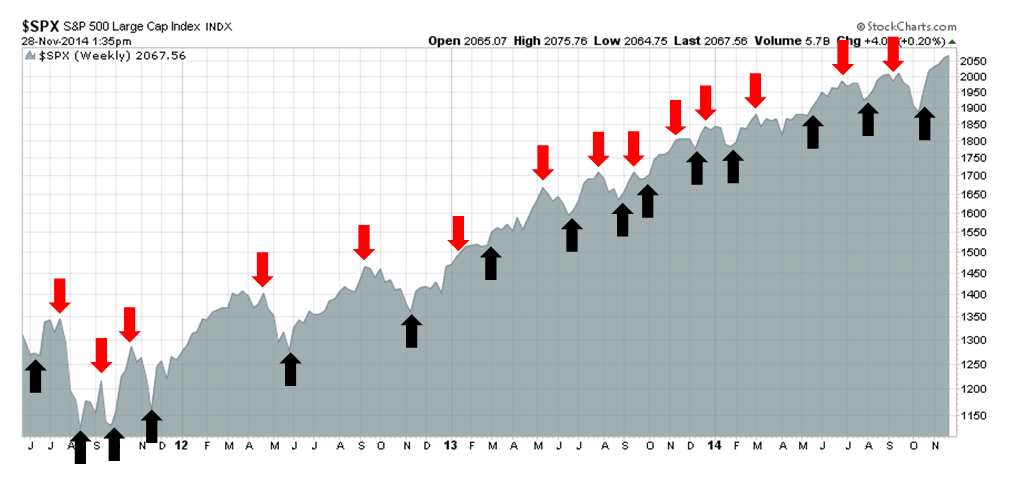
The chart below shows the actual (not back-tested) changes in the direction of the signal, which are indicated by the arrows, overlaid on top of a chart of the SP 500. You can think of the blue up arrows, which occurred when the trend signal changed from negative to positive, as buy signals and the red down arrows, which occurred when the trend signal changed from positive to negative, as sell signals.
Trend Model Signal History
A proof of concept
While the results from the above chart representing paper trading is always interesting, there is no substitute for actual performance. As a proof of concept, I started to manage a small account that traded long, inverse and leveraged ETFs on the major US market averages and, on occasion, sector and industry ETFs. Trading decisions were based on Trend Model signals combined with some short-term sentiment indicators. The inception date of the account was September 30, 2013 and the chart below represents an interim report card of that account.
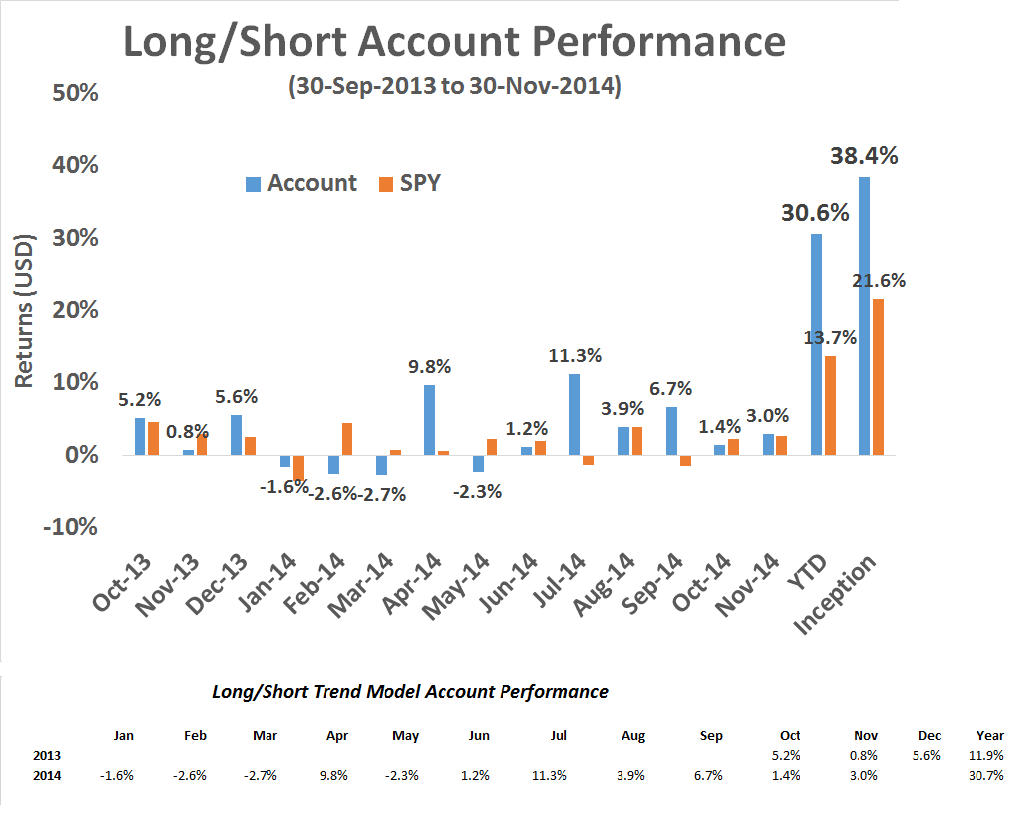
When evaluating the performance of this trading account, keep in mind that this is intended to be an absolute return vehicle. While I do show the SPY total return, which includes re-invested dividends, for illustrative purposes, the SP 500 is not an appropriate benchmark for measuring the performance of this modeling technique.
A solid November
The account was up 3.0% in November, 30.7% YTD. 38.1% for one year and 38.5% from inception (September 2013). However, I would also like to point out that turnover averaged about 200% per month, so this strategy is not for everyone.
In line with the results for the second half of 2014, this strategy continue to be promising:
- Returns are strong and the Trend Model is performing better than expected.
- Returns are highly diversifying compared to major asset classes. They are uncorrelated with equities (correlation of -0.20 with SPY) and bonds (-0.29 with AGG).
I reiterate my points from last month's report card, when I wrote that this account and strategy has benefited from an extraordinarily friendly environment for trend-following models:
To be sure, the Trend Model has benefited from an extremely favorable environment as the stock market has more or less risen in a straight line with very few hiccups. Under more normal market conditions, where the market can be expected to regularly correct 10% or more and move in a more choppy manner, this strategy is unlikely to perform as well in sideways and volatile environments. That`s why I had hoped to see greater market volatility in order to stress test this model.
I am also sticking to my estimate of a sustainable return of 15-25% for this strategy, which is substantially lower than the 35-40% range observed recently:
Given the return pattern of the Trend Model trading account observed in the past 13 month of its young life, my best wild-eyed guess of a more reasonable long-term USD return expectation of this strategy might be in the 15-25% per year, instead of the astounding 35-40% experienced so far.
Results continue to be promising for this model. Readers who want to monitor the signals of the Trend Model to subscribe to my blog posts here, which include Trend Model updates, or follow me via Twitter @humblestudent.
Cam Hui is a portfolio manager at Qwest Investment Fund Management Ltd. ("Qwest"). This article is prepared by Mr. Hui as an outside business activity. As such, Qwest does not review or approve materials presented herein. The opinions and any recommendations expressed in this blog are those of the author and do not reflect the opinions or recommendations of Qwest.
None of the information or opinions expressed in this blog constitutes a solicitation for the purchase or sale of any security or other instrument. Nothing in this article constitutes investment advice and any recommendations that may be contained herein have not been based upon a consideration of the investment objectives, financial situation or particular needs of any specific recipient. Any purchase or sale activity in any securities or other instrument should be based upon your own analysis and conclusions. Past performance is not indicative of future results. Either Qwest or Mr. Hui may hold or control long or short positions in the securities or instruments mentioned.