EUR/USD
To start off; the pair is trading within a possible Bear Flag, as can be seen on the Daily Chart. The base of the flag is close by, but there is quite a decent looking support sighted at 10870 handle.
Today, we have important releases on euro, and it looks quite heavy on the news front. Starting with Interest Rate, followed by ECB Press Conference, and 90 minutes later, we have Fed Chairperson Yellen testifying. I need not say caution required, but looking from a technical point of view, if the pair can stay under 10985-95, we would expect a move lower to the Wednesday high to test a decent looking support on the Daily / 8 hr, and other smaller time frame coming to 10870.
In short, this level holds the key for the price to either head lower, testing the base of the flag, or it is ready to bounce and try to get to the higher grounds. A good bounce shows a potential run towards 1.1275-90 in the coming days then. This implies that if and once we have tested 10870, the pair has managed back to close above 10940, and eventually higher to the 2 hr listed resistance.
Below are a series of charts, each showing expected moves.
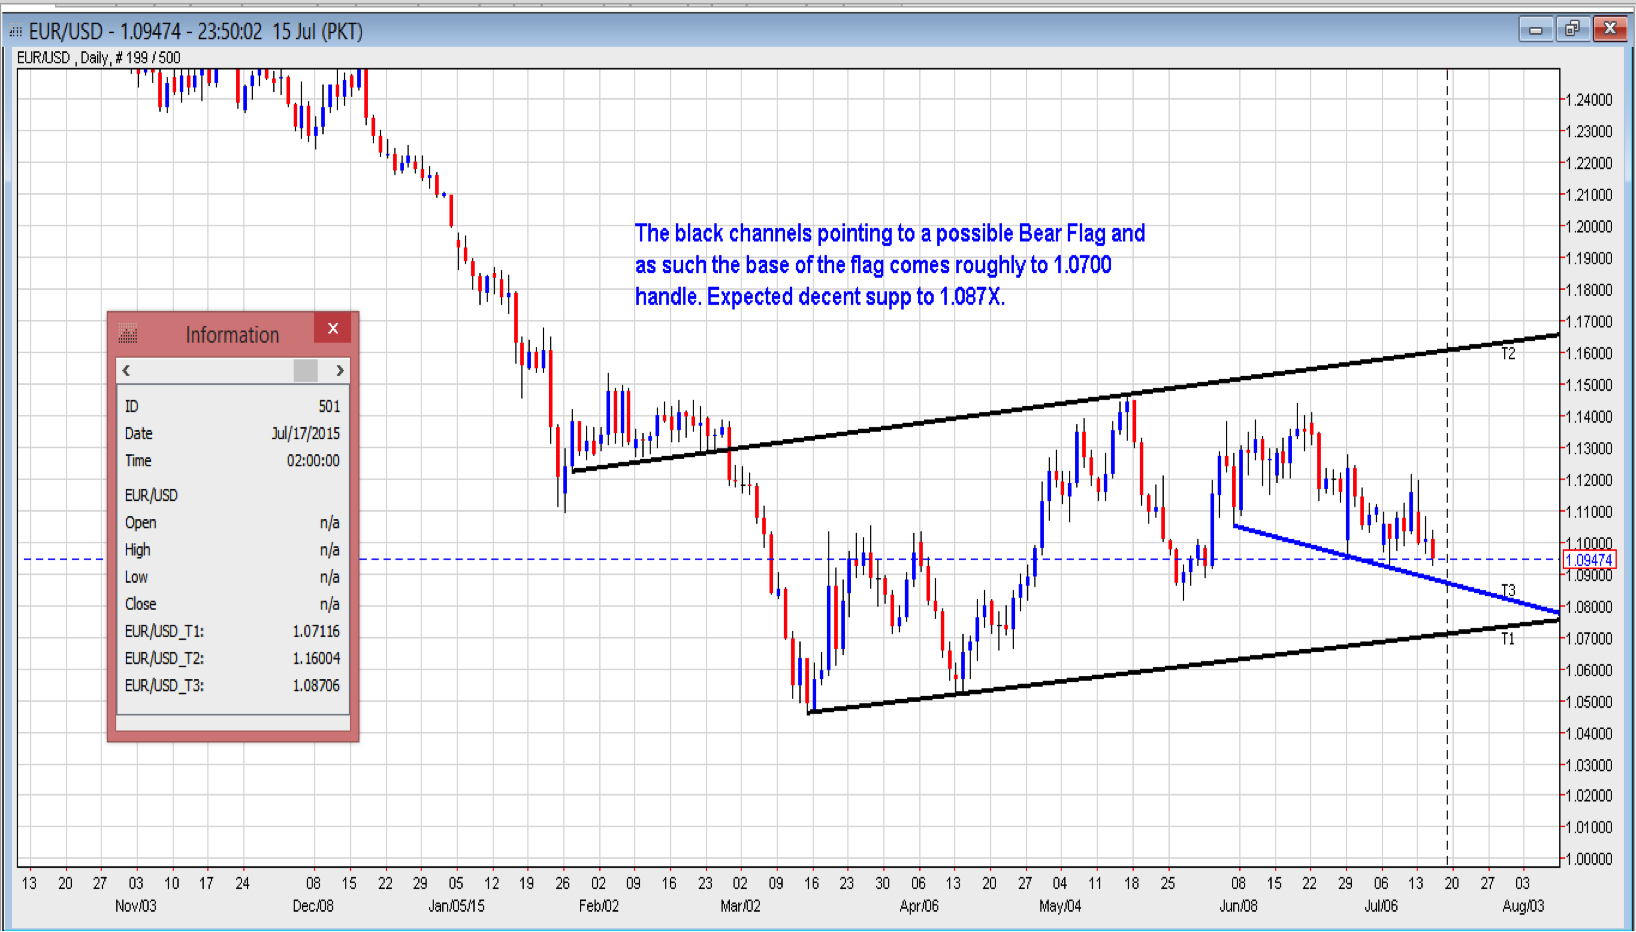
EUR/USD – Daily. Shows the Bear Flag and 1.0870 support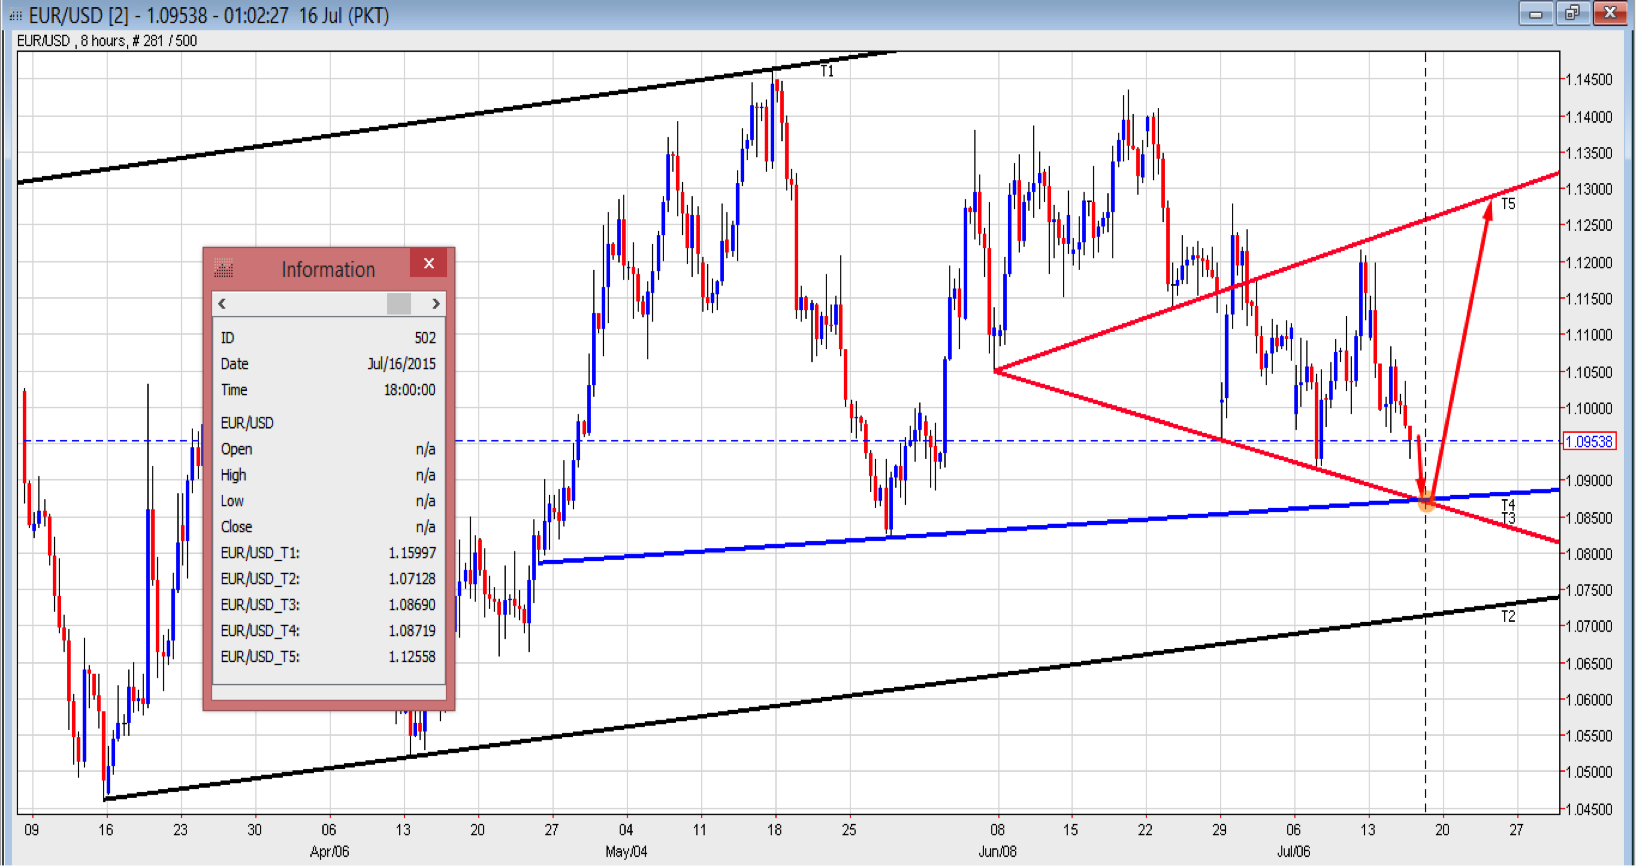
EUR/USD – 8 hrs. Shows 10870 has been a dual support. The channel in RED Trend Lines may come into play if we get a test of 10870 and a lift off from it. 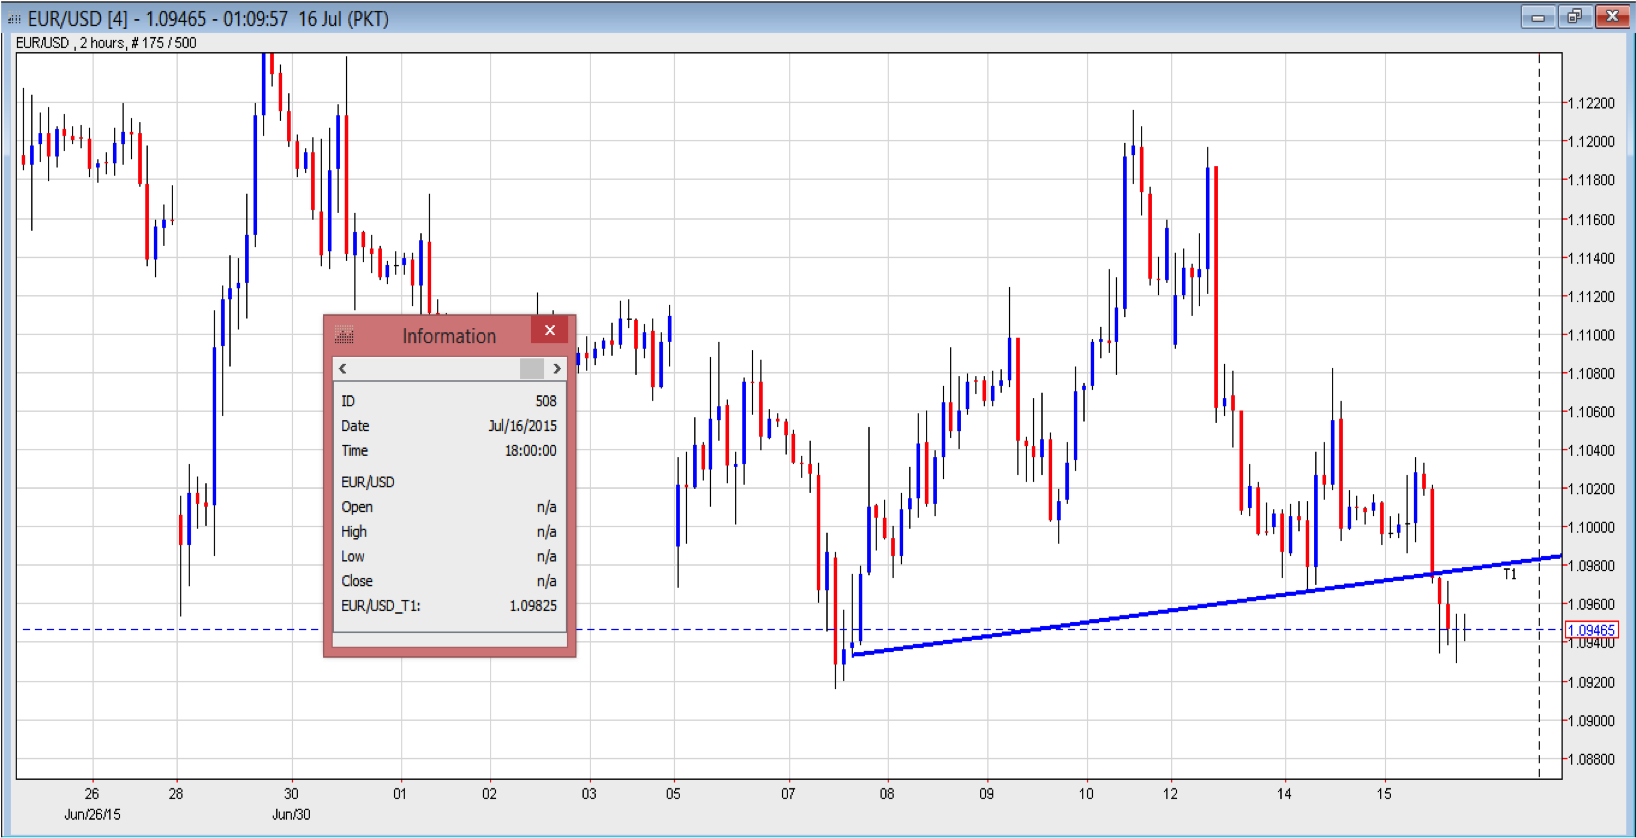
EUR/USD – 2 hrs. Just a recent break point and as such, a resistance on rallies.
It just might sound very bold, but I like to call it ‘The King Dollar’. With the possibility of a rate hike coming this year and Yellen to testify today as well, we just might see US dollar breaking higher to the current resistance tops and march higher.
Talking from a technical point of view, I have used a series of charts on various time frames to illustrate my strong US dollar view. In short, my strong US dollar view is one breakout away, as shown on the 8 hour chart layout.
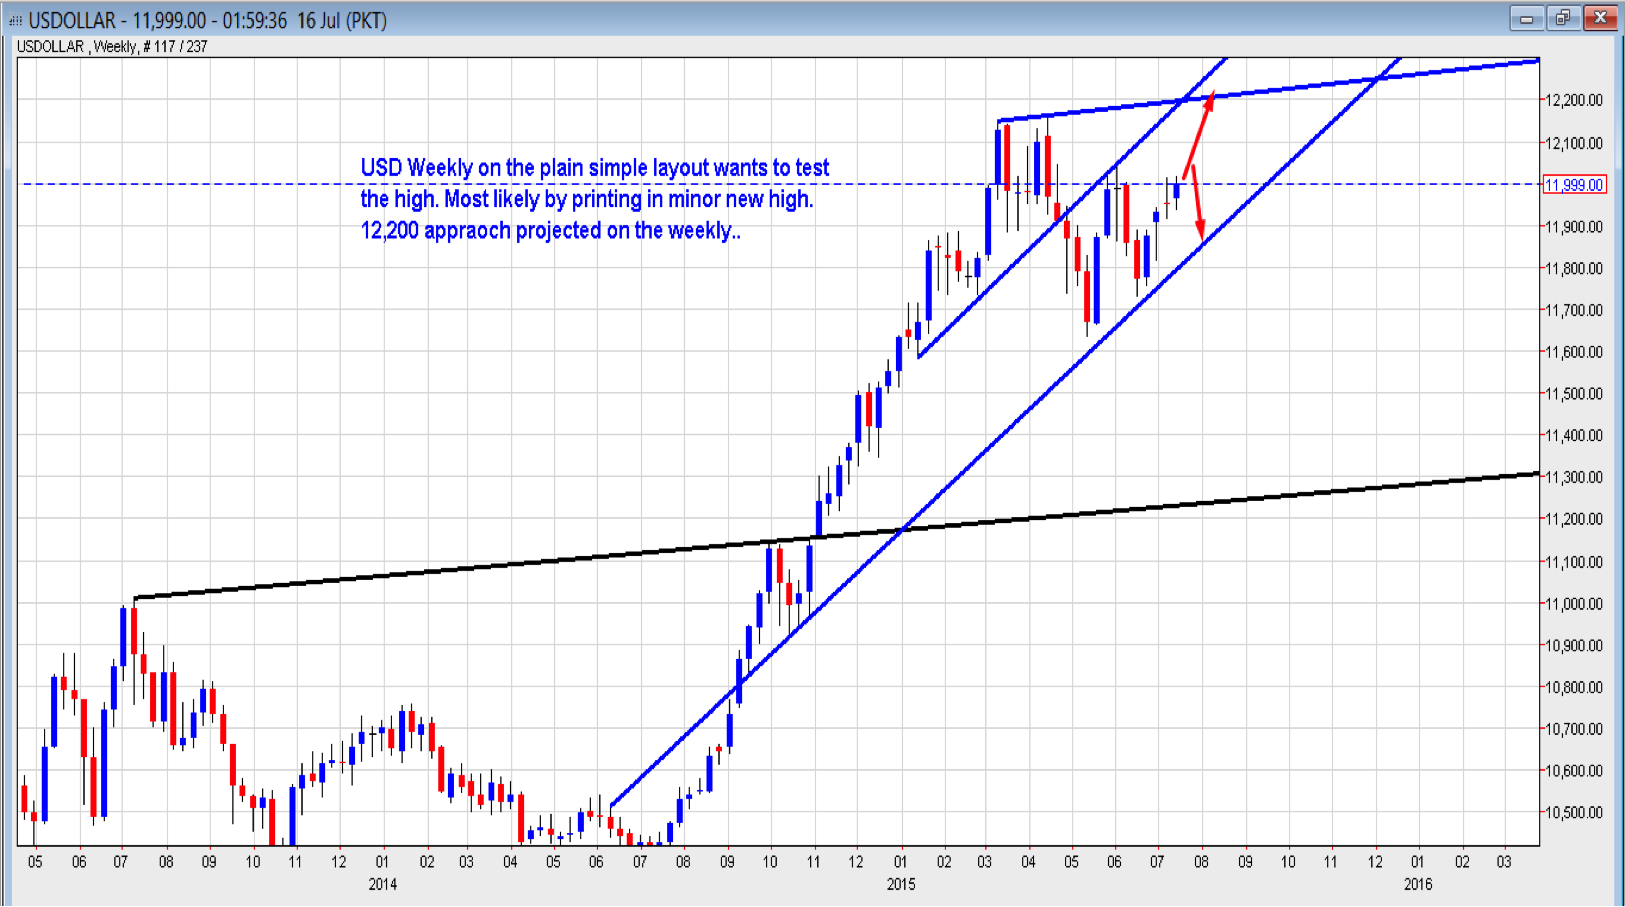
US dollar – Weekly. Showing a bullish channel that tops, if comes into play, ends up posting minor new high. 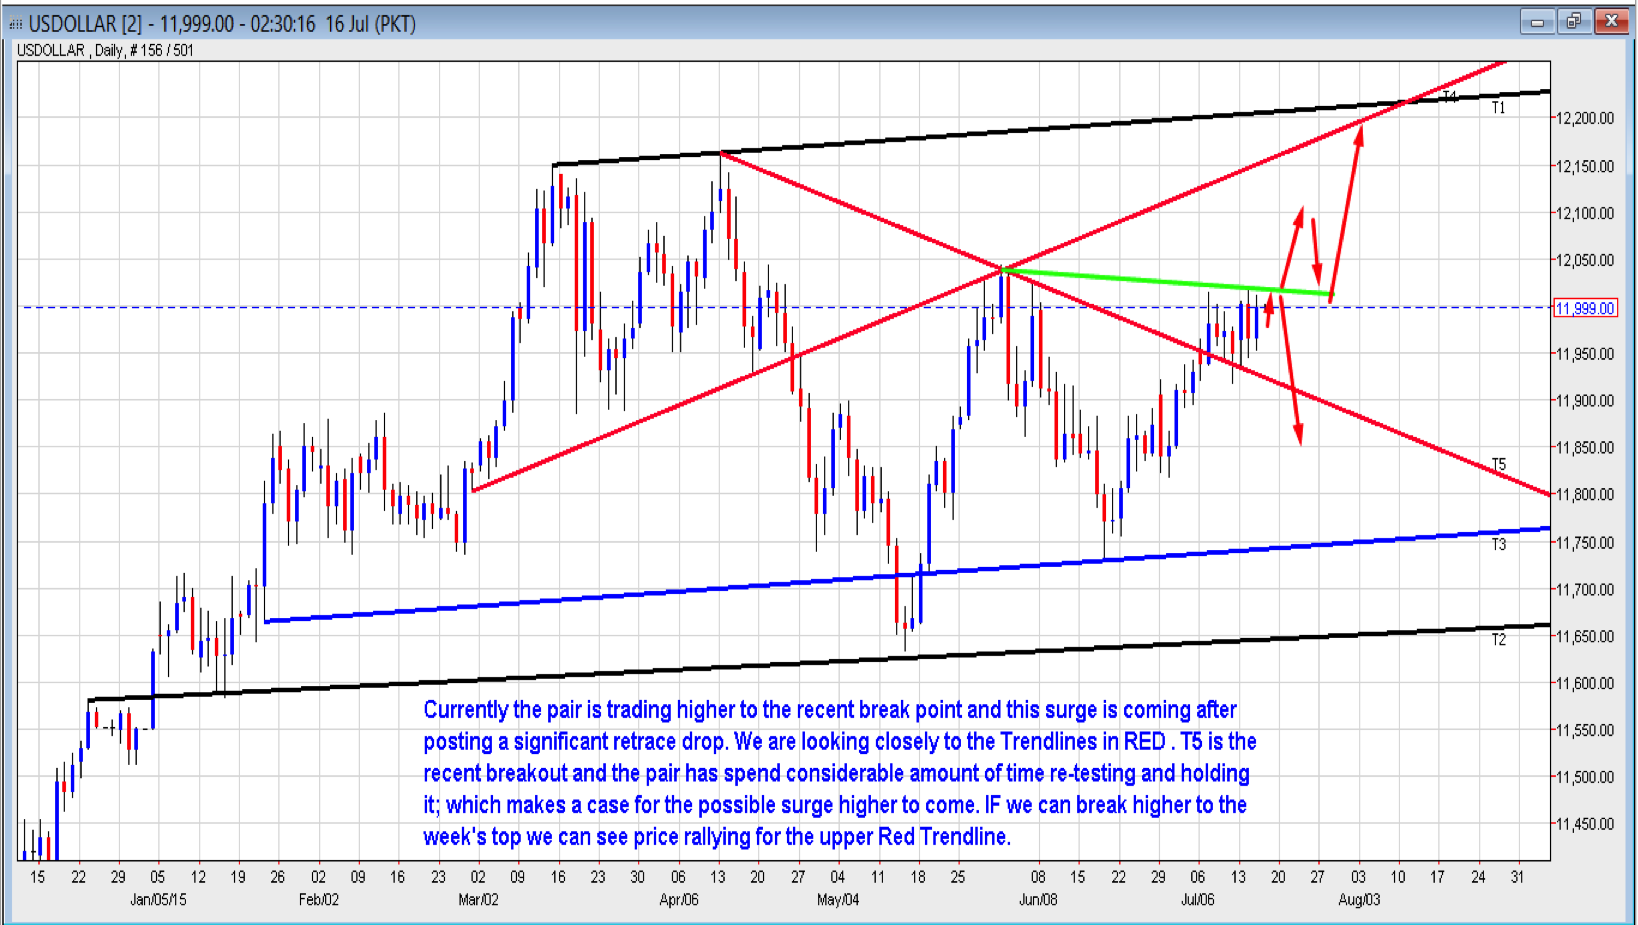
US dollar – Daily. Showing a break higher to T5 and retest back to it and holding, which is pointing to an eventual break higher up coming. 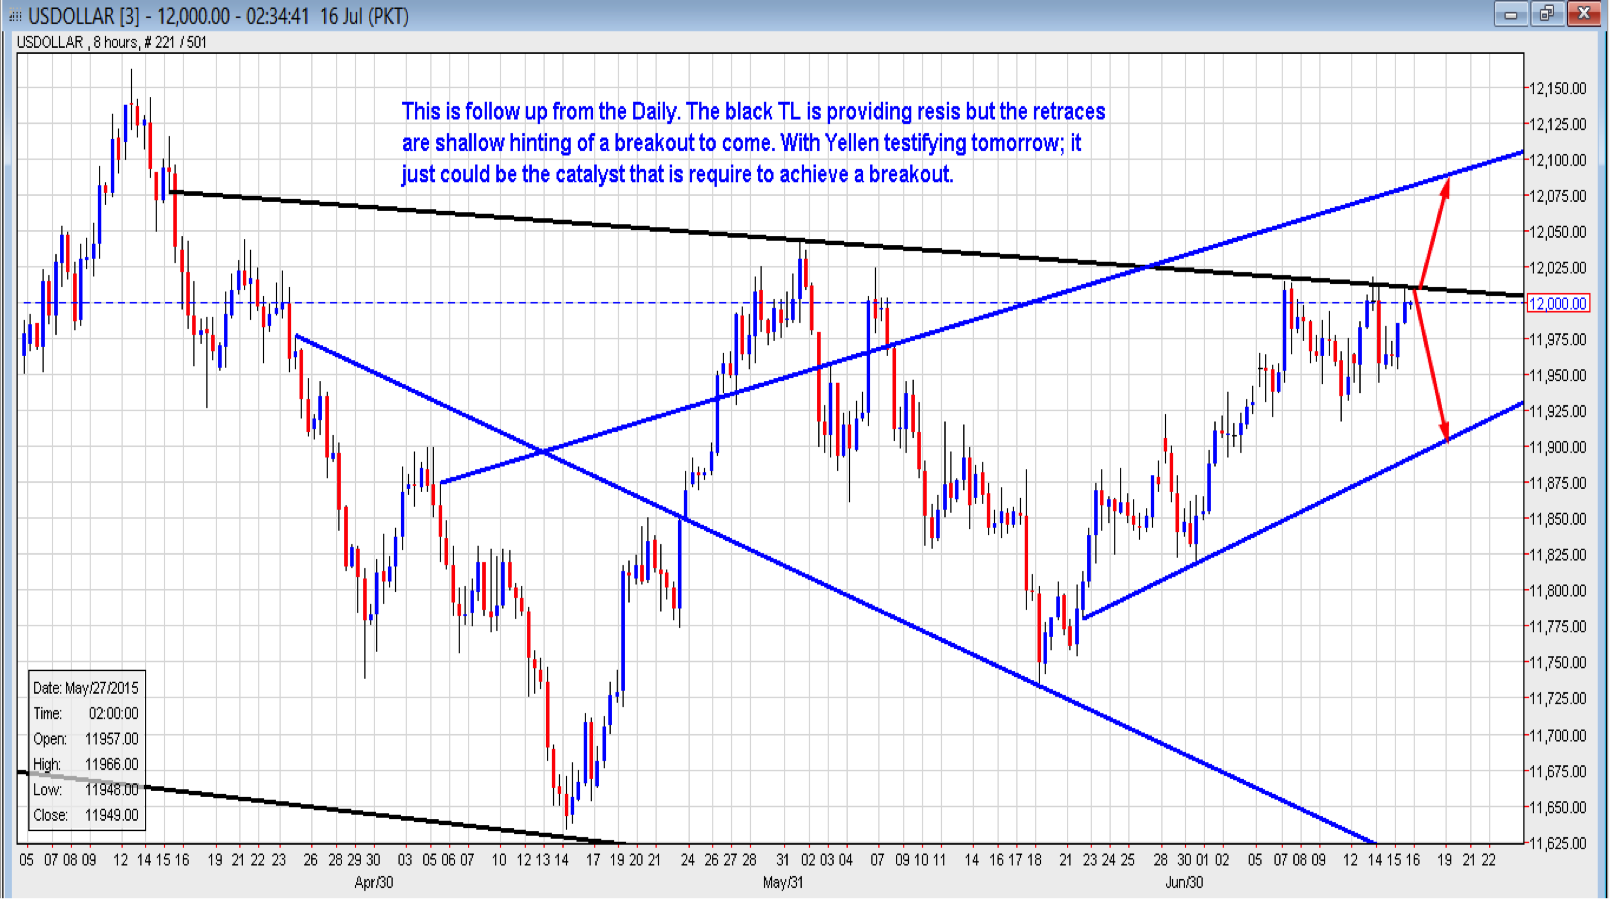
US dollar 8 hours – We either break above to the black Trend line and lift off, or else risk a deeper retrace.
AUD/USD
The pair has been in a constant downtrend after posting 0.8090 high, and briefly finding support and forming base to 0.7600 handle, which was short lived.
AUD/USD, a commodity currency, has been hit hard by falling commodity and metal prices, along with slowing down in China. At the present, it is too early to call in a bottom on the pair; however, we're looking at a possibility that 7270-80 for the day comes in as a decent looking support. Interested in the black Trend Line, which helped in forming the 0.7600 level as a supporting base for a short while, and if we get another attempt to it, can expect an initial hold to it and, as such, a possibility of bounces.
With Yellen later today, we can see a drop to the intended level in case US dollar surges.
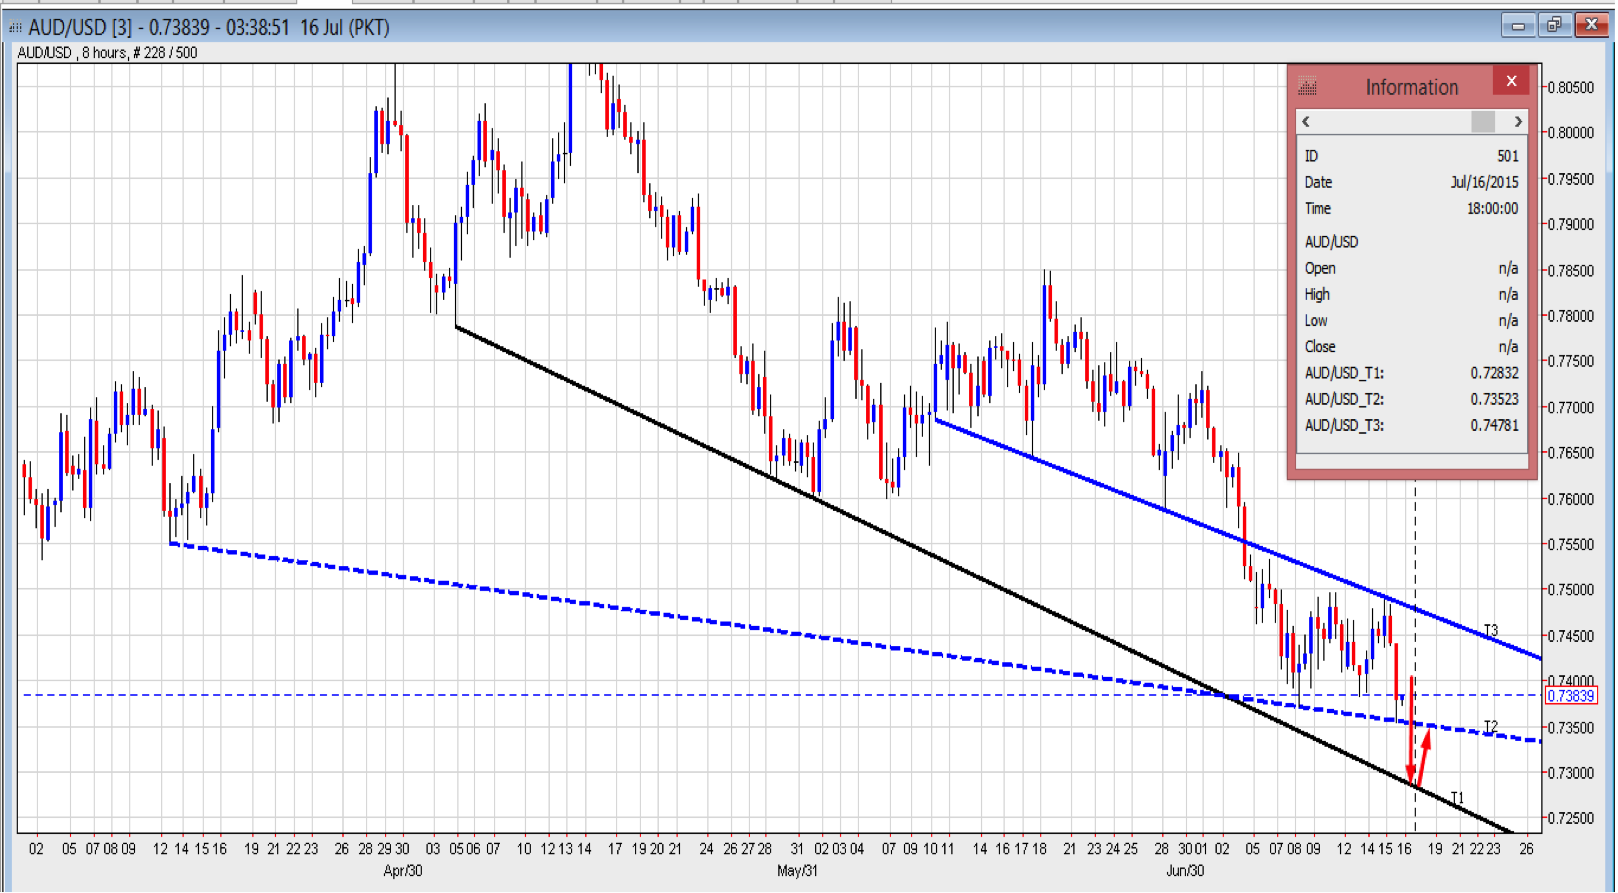
AUD/USD – 8 hours. A test to 7280-83 and a hold can provide some kind of a relief rally.
