Yesterday was quite dramatic beginning with FOMC and ending with an upbeat US dollar. Though we didn’t have the rate hike announcement today, it is soon to come and that has given the dollar a lift considering the fallout it endured for the past 2 days of trading.
Most of the commodity crosses were able to rally particularly against the EUR and later against the GBP which was needed to overcome the over-bought conditions on them. The GBP still seems to be taking on the crosses while the euro needs to do something special, but nevertheless it’s crosses are at main support zones and can stage a comeback rally.
GBP/NZD
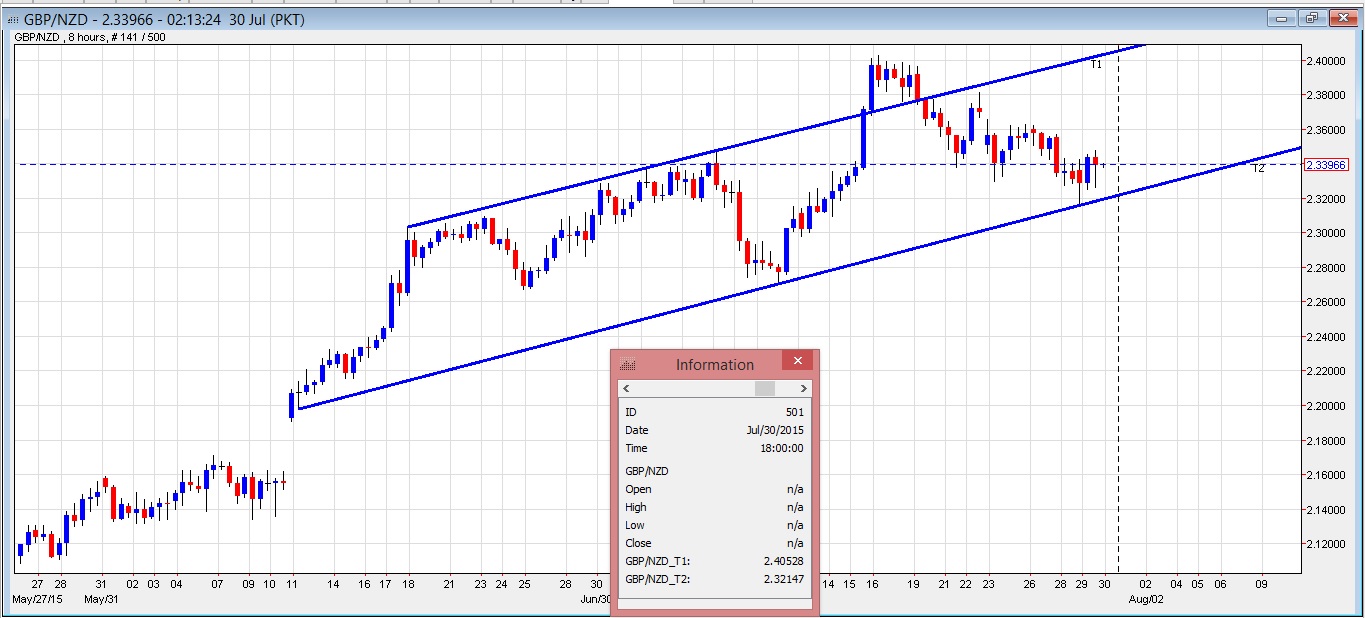
We are looking to enter buys off the 8-hour chart around to T2 trend line if we can hold out to this level there is plenty of room to run. The ideal target on the run higher can post newer highs with a run into early 2.35XX being the soft target. A break higher and a close would imply we have more follow through likely coming in.
GBP/NZD has been hit hard with the pair rallying leaps and bounds on NZD weakness due to rate cuts and hints of GBP rate hikes making GBP the preferred currency over the NZD. The pair however required some relief to shun off the over-bought condition and as such we believe the relief rally is coming to an end and the continuation of the direction to prevail.
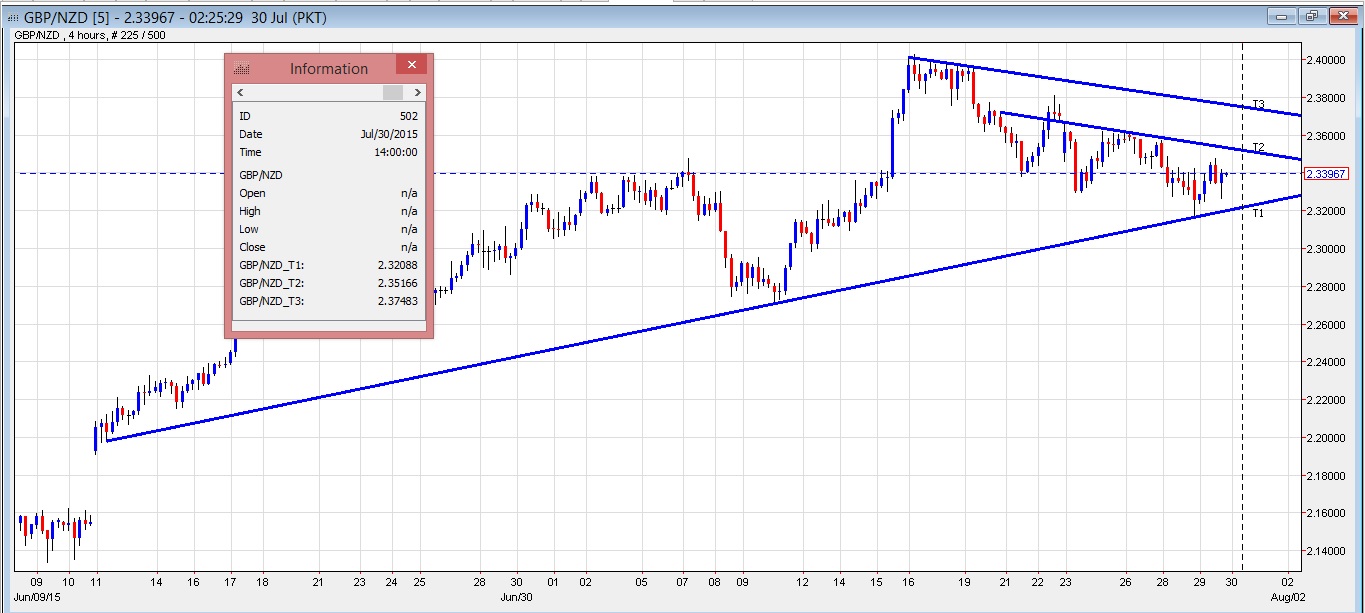
Hence we are interested to initiate longs off T2 on 8-hour or T1 on the 4-hour (both same on support) and try to take it to newer highs; considering we have taken out initial resistance based on the 4-hour (T2) which is also our soft target.
 Main chart and T2 zone to enter longs.
 T2 been soft target on the intended longs and this is also a break point to carry the rally to next target zone T3.
EURJPY
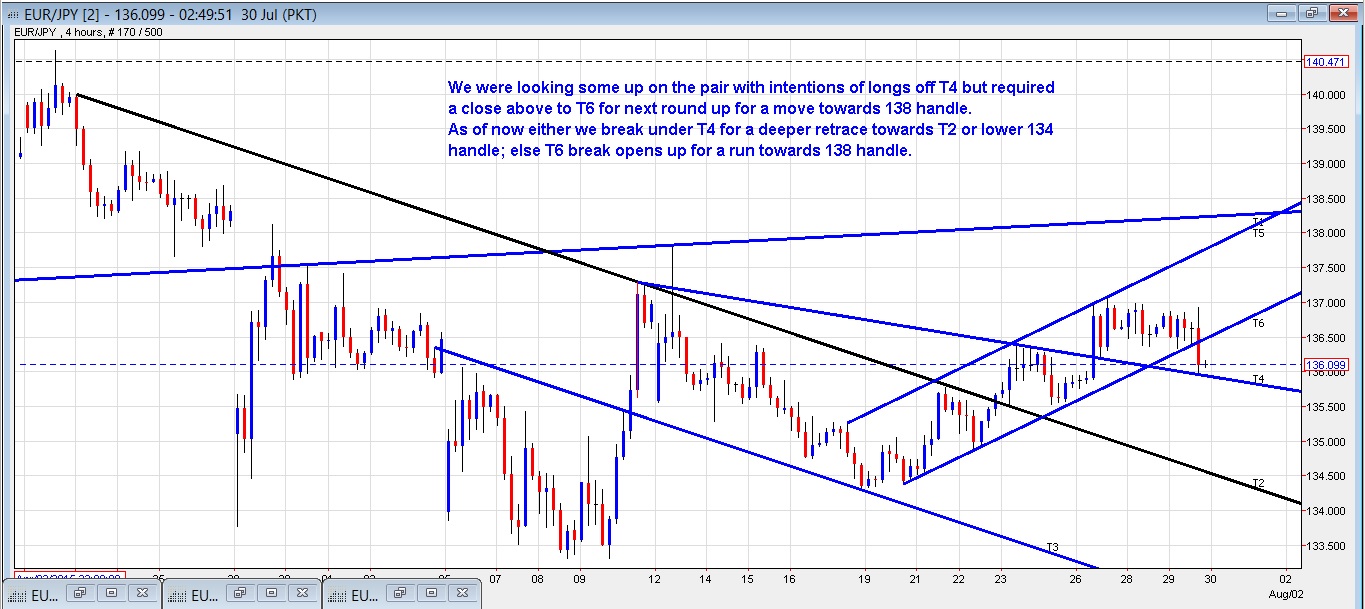
We are interested in taking cautious longs off T4 for a possible break higher to 136.6X to gather pace towards 138 handle or else sell the break under T4 for a deeper fallout on the pair.
The pair was looking quite straight forward on yesterday’s analysis to pick longs up from T4 trend line, however the scenario has changed by today’s close. The pair, while holding to the 135.9X support zone, is seeing shallow bounces and is well under 136.6X crossover point it requires to break for momentum to build for the rally higher. As such, while the T4 still is at breakout point and is getting a retest to see if it can hold on to it, has potential for a 136.6X play before either breaking and heading higher or failing to it.
Hence we can still attempt to be long off the intended support and if the price holds to the T6 trend line or 136.6X can look to bank and go short with stop and reverse on a break higher. Alternatively, can look to sell the T4 break (declining and can come as low as 135.83-85 as we progress).
 T4 breaks for move to the lower side; else T6 breaks for a move towards 138 handle.
USDCAD
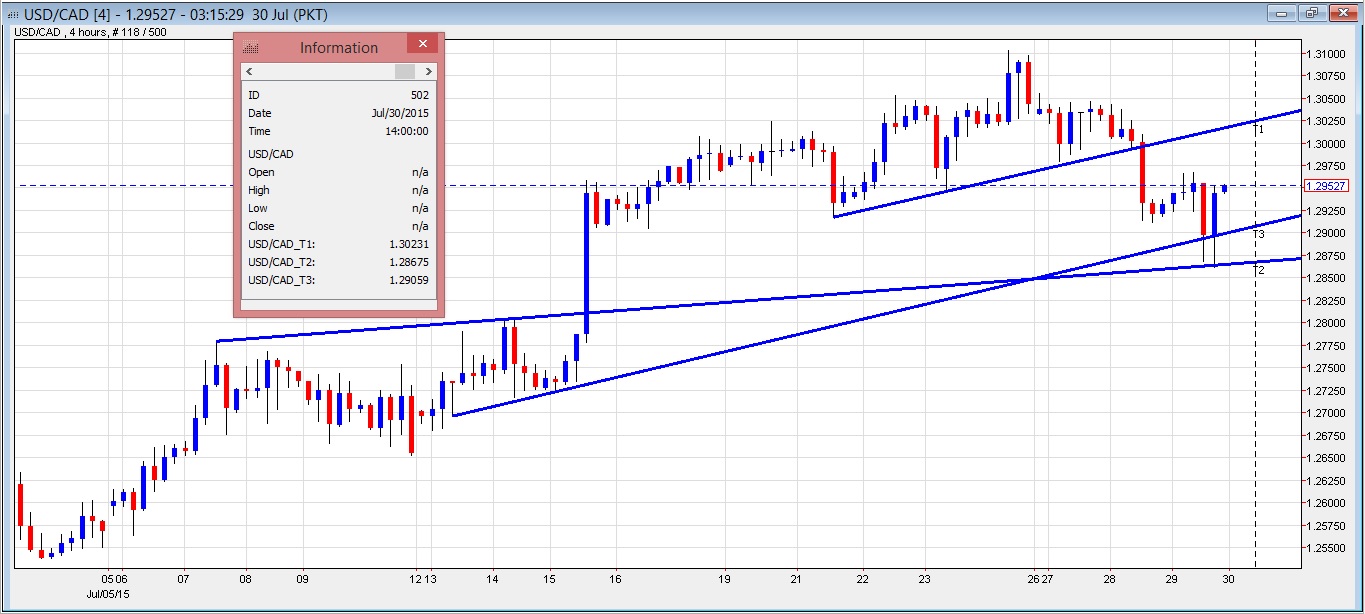
We are looking for some dips on the pair to enter longs around 2905-10 zone for a possible move towards 302X with around 2980 been soft target.
USD/CAD made quite a move today prior to the FOMC statement on back of oil rallying. The pair was met with a support zone which was a previous resistance and it held provoking a decent bounce, hence hinting at surge higher. Overall the pair looks bearish against the USD and as such this is possibly where we ended the correction and can see continuation of longs with 302X been initial target. It doesn’t help with a dovish BOC compared to upbeat FEDs and the interest rate differential evidently will play an important role in days to come.
Hence with a view that a much needed correction ended on the USDCAD we can start looking at higher USDCAD and a retrace lower to 290X will be our preferred entry to try longs.
 2905-10 test and a hold to enter longs.
