The Office of Financial Research at the US Treasury, published a brief on March 17, warning of historically high valuations in the US stock market, and the potential for a sudden and painful drop in prices. It’s worth a read.
The eventual move by the Fed to raise interest rates, while likely modest, and while at rates well below rates that have not been a problem for stocks in the past, is likely to cause a degree of shock that will create a correction.
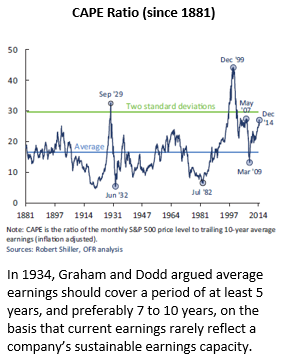
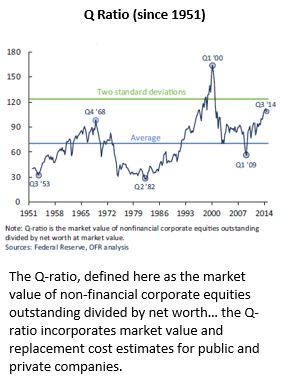
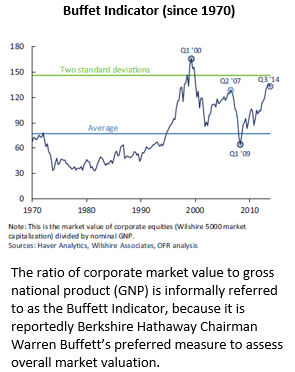
The basic argument by the OFR is that when certain ratios reach 2 standard deviation distances above their very long-term averages, they create great risk of a corrective movement back toward the long-term average. That “mean reversion” tendency is a real thing, but when and whether the reversion takes place is hard to pinpoint.
They make note of the fact that the stock market has seemingly stretched valuations, at the same time that the economy as they describe it is not doing all that well.
The three indicators they present are:
- Shiller CAPE Ratio
- Tobin Q Ratio
- Buffet Market Value to GDP Ratio
The CAPE Ratio (10-year CPI adjusted P/E) is approaching 2 standard deviations, and is at the approximate level of 2007. The only two times it exceeded 2 standard deviations by this measure was in 1929 and 1999 — both bad years to own stocks. However, the indicator did not signal the 2008 crash early enough to save a lot of money.

The Q Ratio (replacement cost of plant and equipment of public and private non-financial companies versus their financial statement net worth), is approaching 2 standard deviations. However, the indicator did not signal the 2008 crash.

The Buffet Indicator (total stock market-cap divided by GNP) is approaching 2 standard deviations. The indicator may have turned early enough for a close watcher to get out of the way of 2008.

The article goes on to identify other concerning facts, such as:
- forward P/E ratios in common use having little predictive value
- valuation arguments based on low interest rates not considering the macro-economic implications of low interest rates
- historically high profit margins before and after tax
- total profits 10-year rolling average above the regression trend of the average, and total profits above the 10-year rolling average
- poor stock returns in years following high valuations
- high margin debt at historically high percentage of total stock market value.
On a more optimistic note, David Rosenberg of Gluskin Sheff, made a strong statement a few months ago, that virtually all bear markets are preceded by an inverted yield curve (short rates above intermediate rates), and the Fed raising the discount rate.
We think his ideas are more compelling, because they directly deal with the investor alternatives of debt or equity, and the effect of interest rates on the ability of companies and households to borrow and for companies to cover interest expenses.
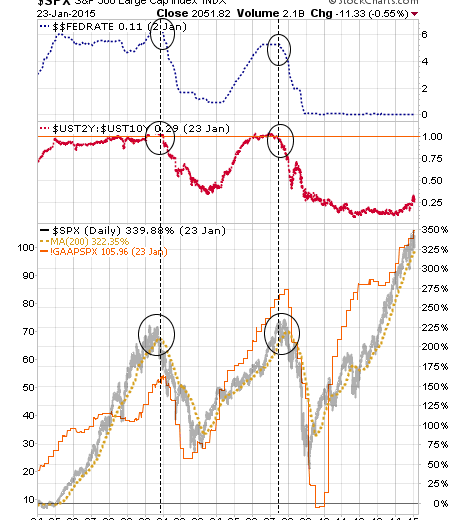
Looking only at the 2000 and 2008 crashes, we see something a tad different than Rosenberg, but still using his favorite indicators (the yield curve as implied by the 2yr-10yr Treasury yield spread; and the Federal Funds Rate).
This weekly chart shows the Fed Funds Rate in the top panel (blue), the 2yr-10yr yield spread in the middle panel (red) and the S&P 500 in the bottom panel, along with its 40 week moving average, and the reported GAAP earnings per share.
Here is what we see. When the S&P 500 falls below its 40 week average AND the yield curve has been flat (1.00 on scale) and then begins to steepen, AND the Fed Funds Rate begins to fall; that coincided with the tops. We are not anywhere near those conditions now.
However, history does not repeat — it only rhymes; and there has not been a period in the US in the past like this one. Perhaps investors are so used to zero interest rate policy that they will panic once debt starts to pay a little more. We’ll see. What do you think?

