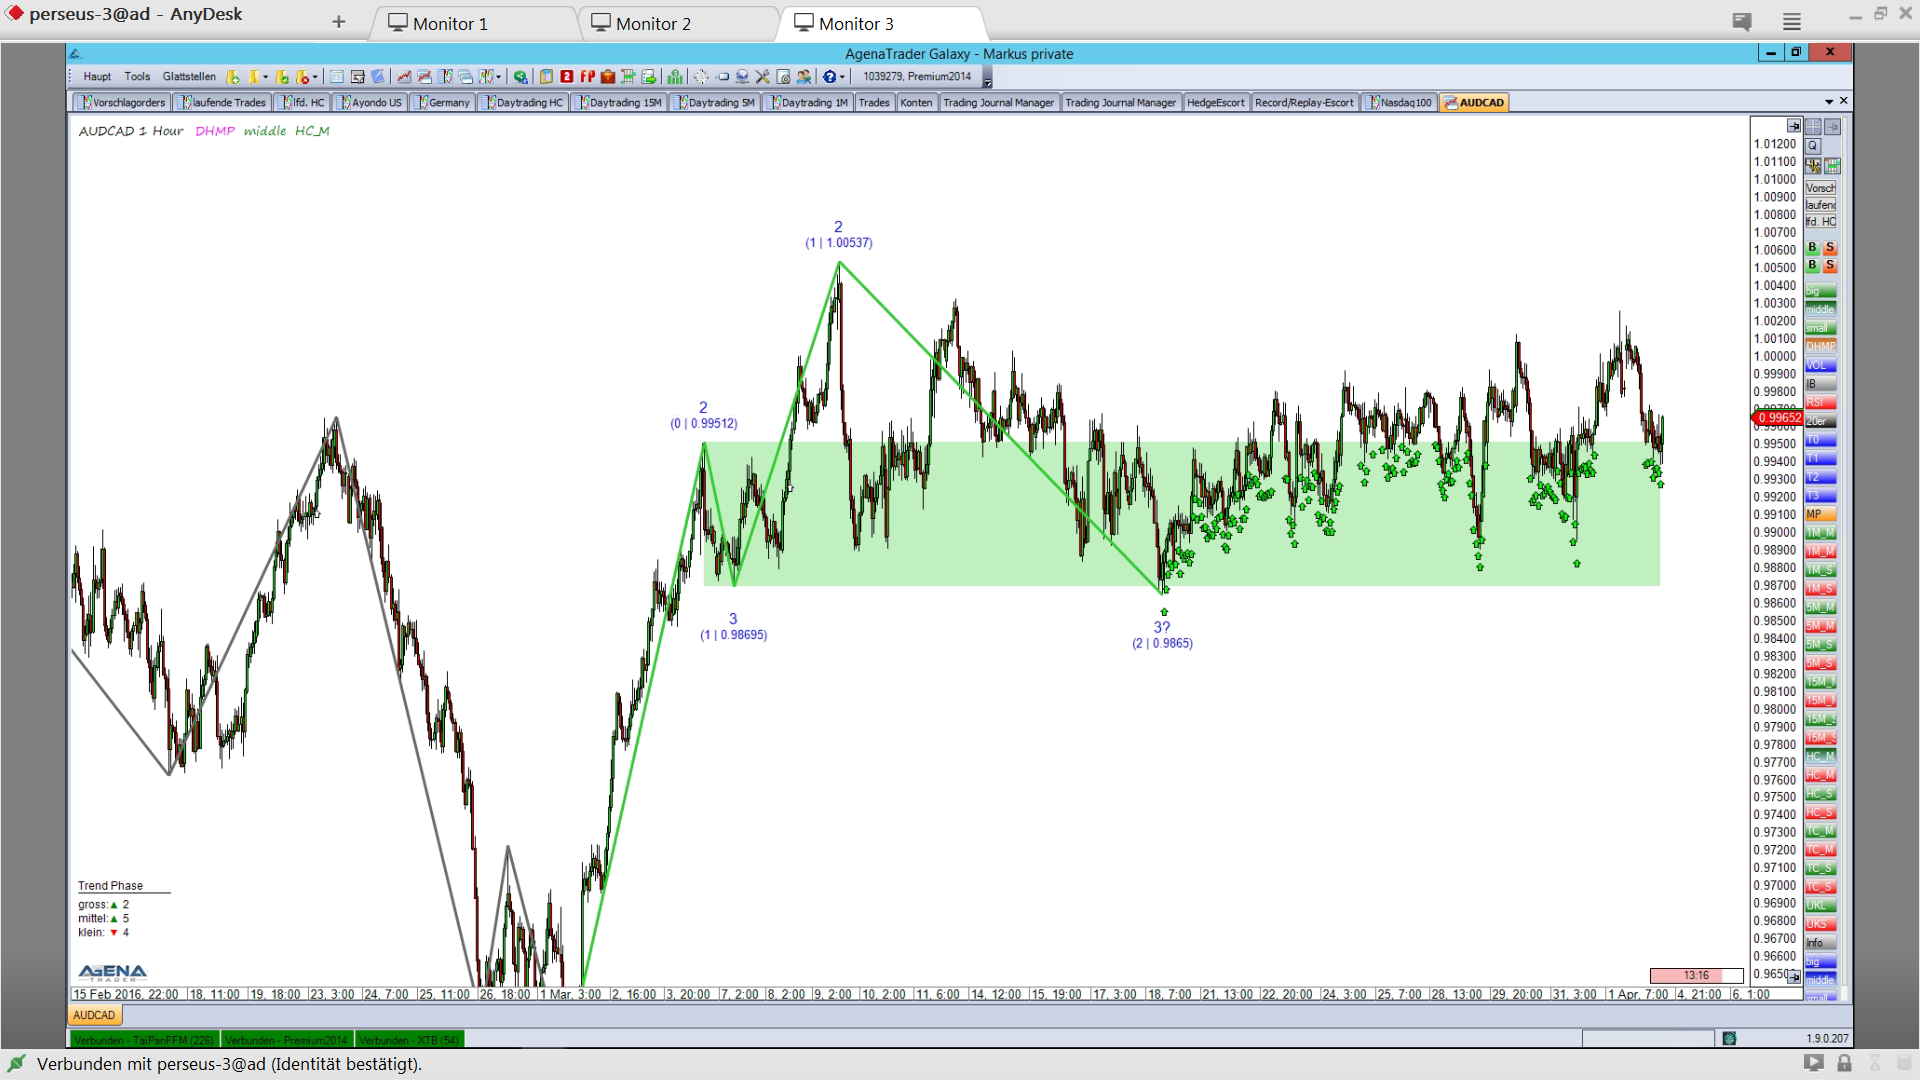
In this forex pair we can see a very young uptrend in the medium trend size. The last correction led the price deep down into the green correction zone. At the lower edge, enough buyers appeared to create the next move. Yet the price fell back down over and over again, and the trend was unable to continue up until now. But the DowHow signals are still valid, and we have the chance to speculate on a trend continuation once more. With regard to a long trade, the stop should be placed below the green zone.

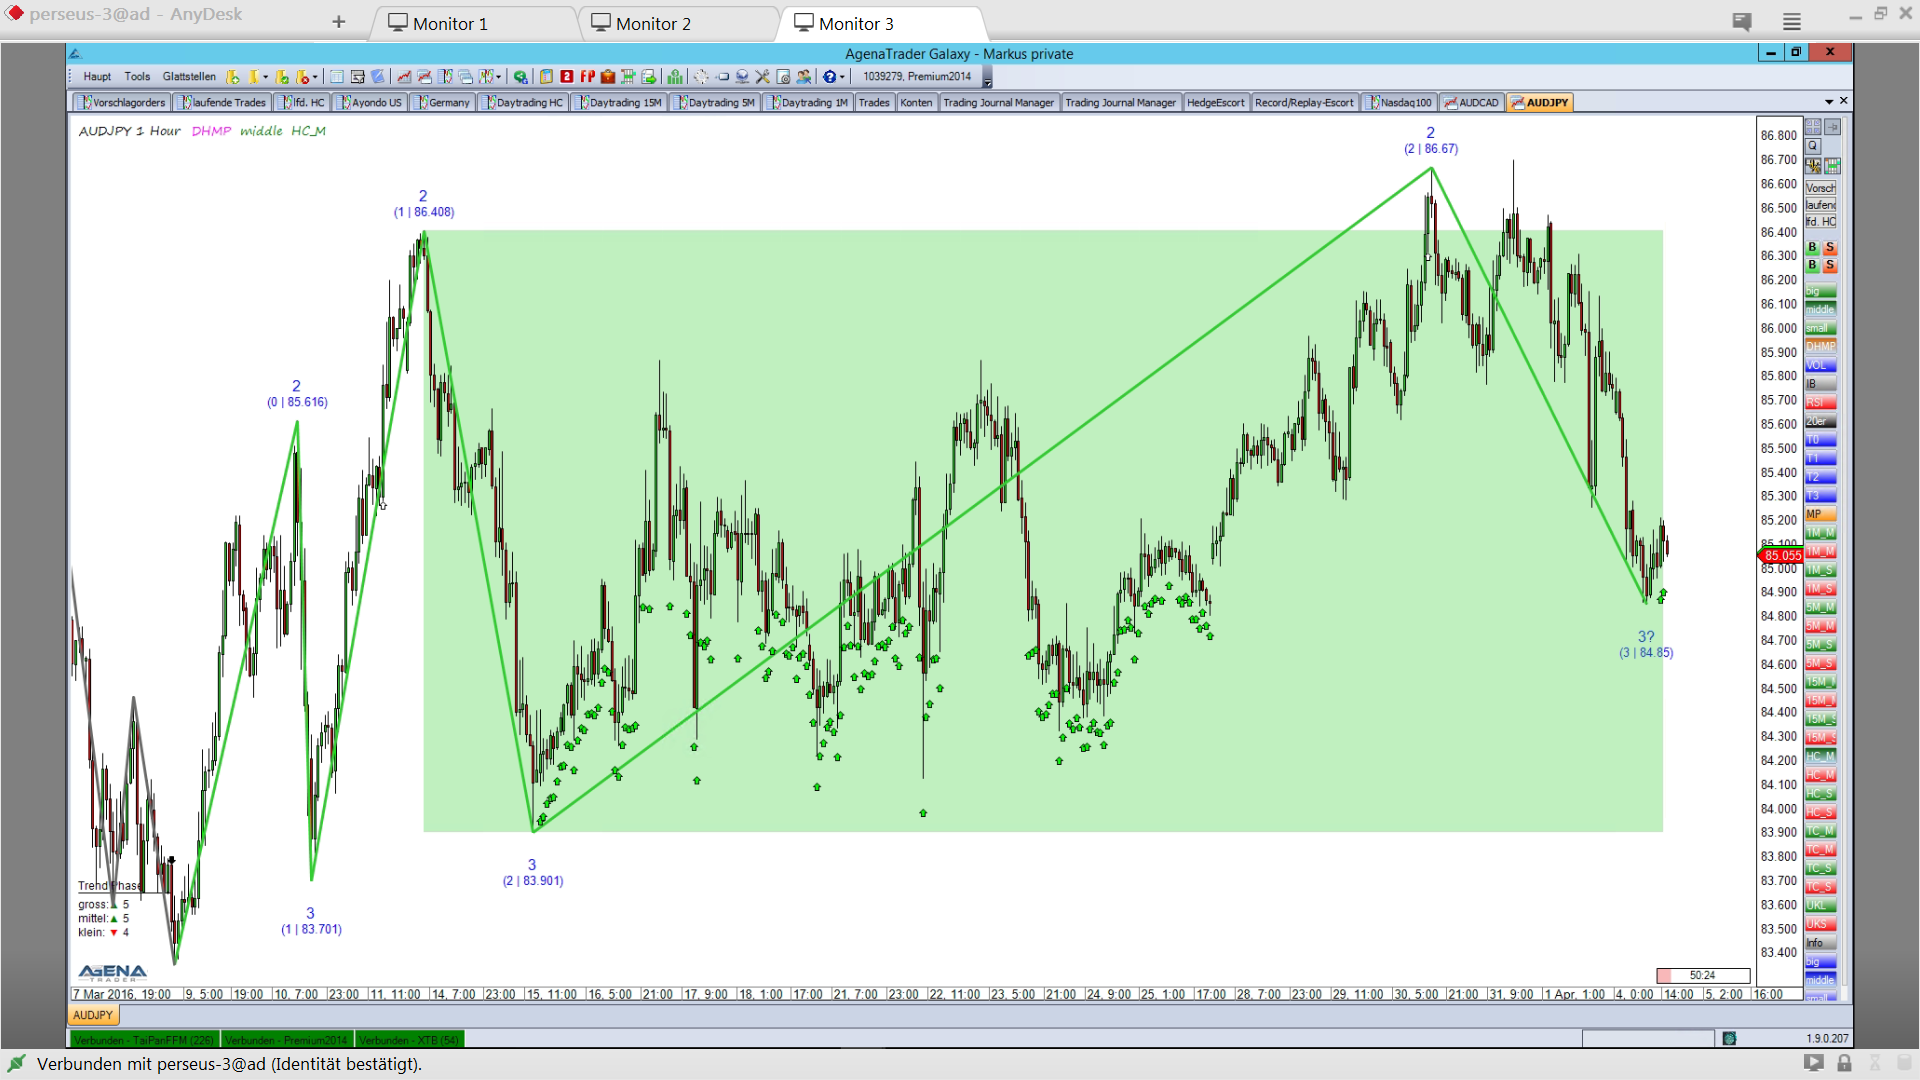
In this pair we have a similar occurrence. By means of the last DowHow signals, we were able to see that the recent increase led the price up to the last point two at 86.40 JPY, and has created a new point two at 86.67 JPY. After this, the price fell back into its correction zone, but not too far, and it attempted a new increase immediately. However, the trend was unable to continue since we do not have a close above 86.76 JPY. This means that the current correction zone between 86.40 JPY and 83.90 JPY still remains valid. As we can observe now, with the most recent green candles we have received a new DowHow signal, and we are able to start a new attempt at a long trade. A stop should be placed below the green zone, and the first target should be located at the last point two at 86.67 JPY.

Macerich Company (NYSE:MAC)
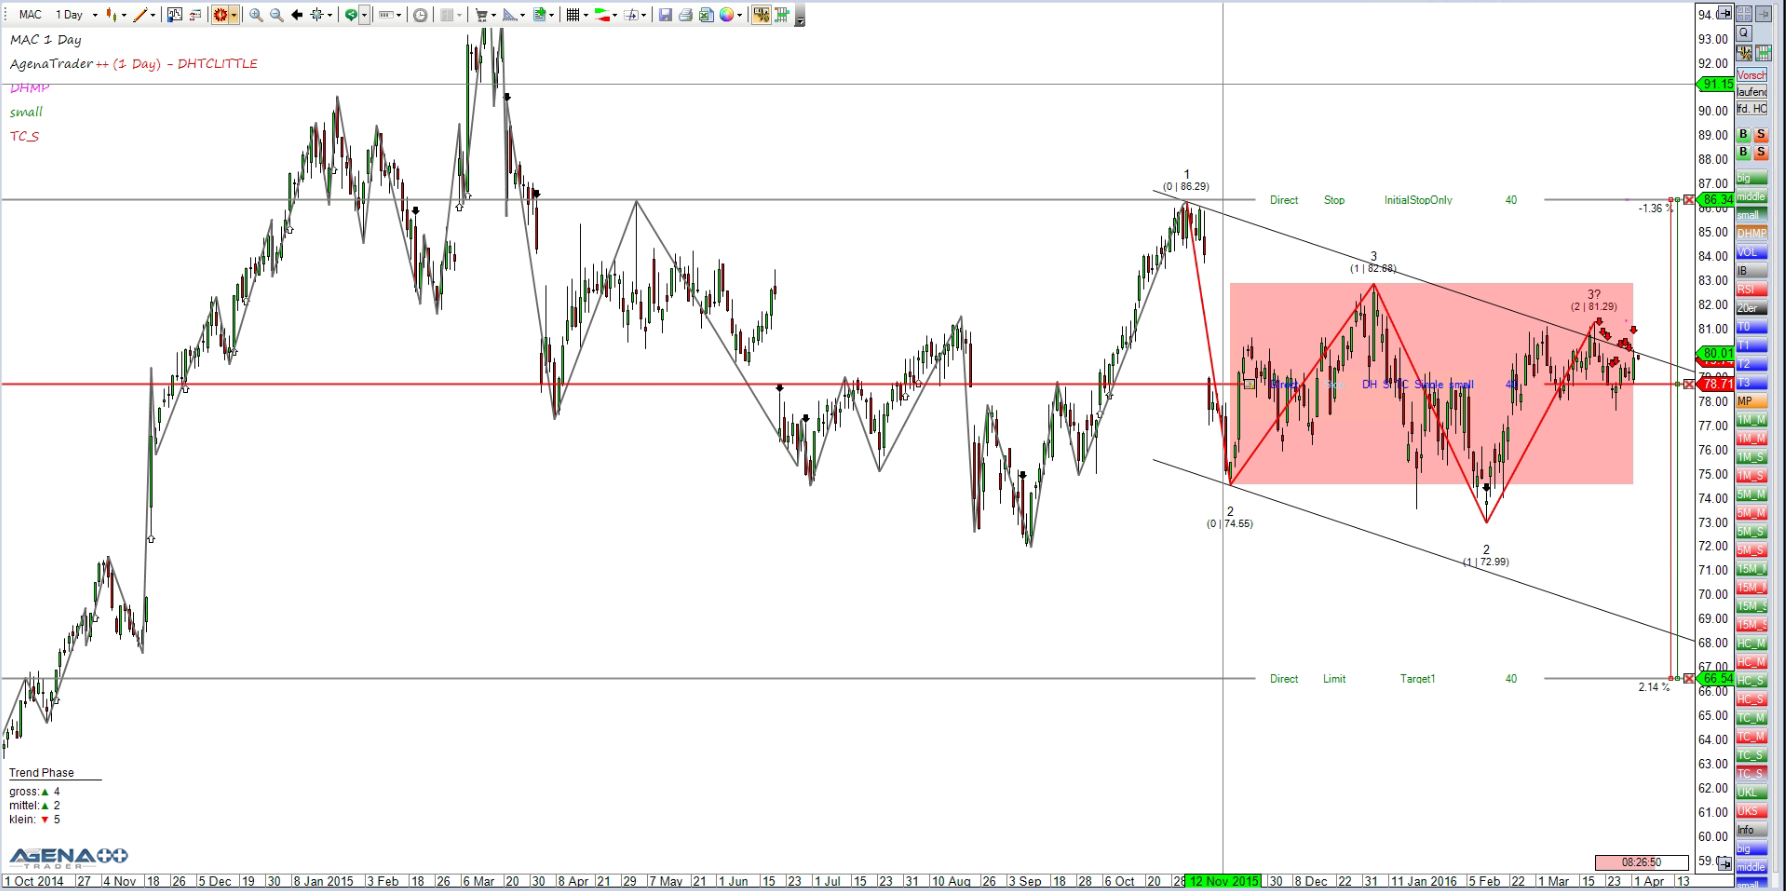
In this value we come across a very interesting situation. First we see a young downtrend with a correction zone between $74.55 and $82.88 on the upper side. In the meantime, the price has corrected deep into this zone and then bounced at the visible upper trend line of this current trend channel. Here we can speculate that enough sellers will appear to ensure that we see a trend continuation. As you can see, I have placed a short order with a stop above the red zone.

Halliburton (NYSE: NYSE:HAL)
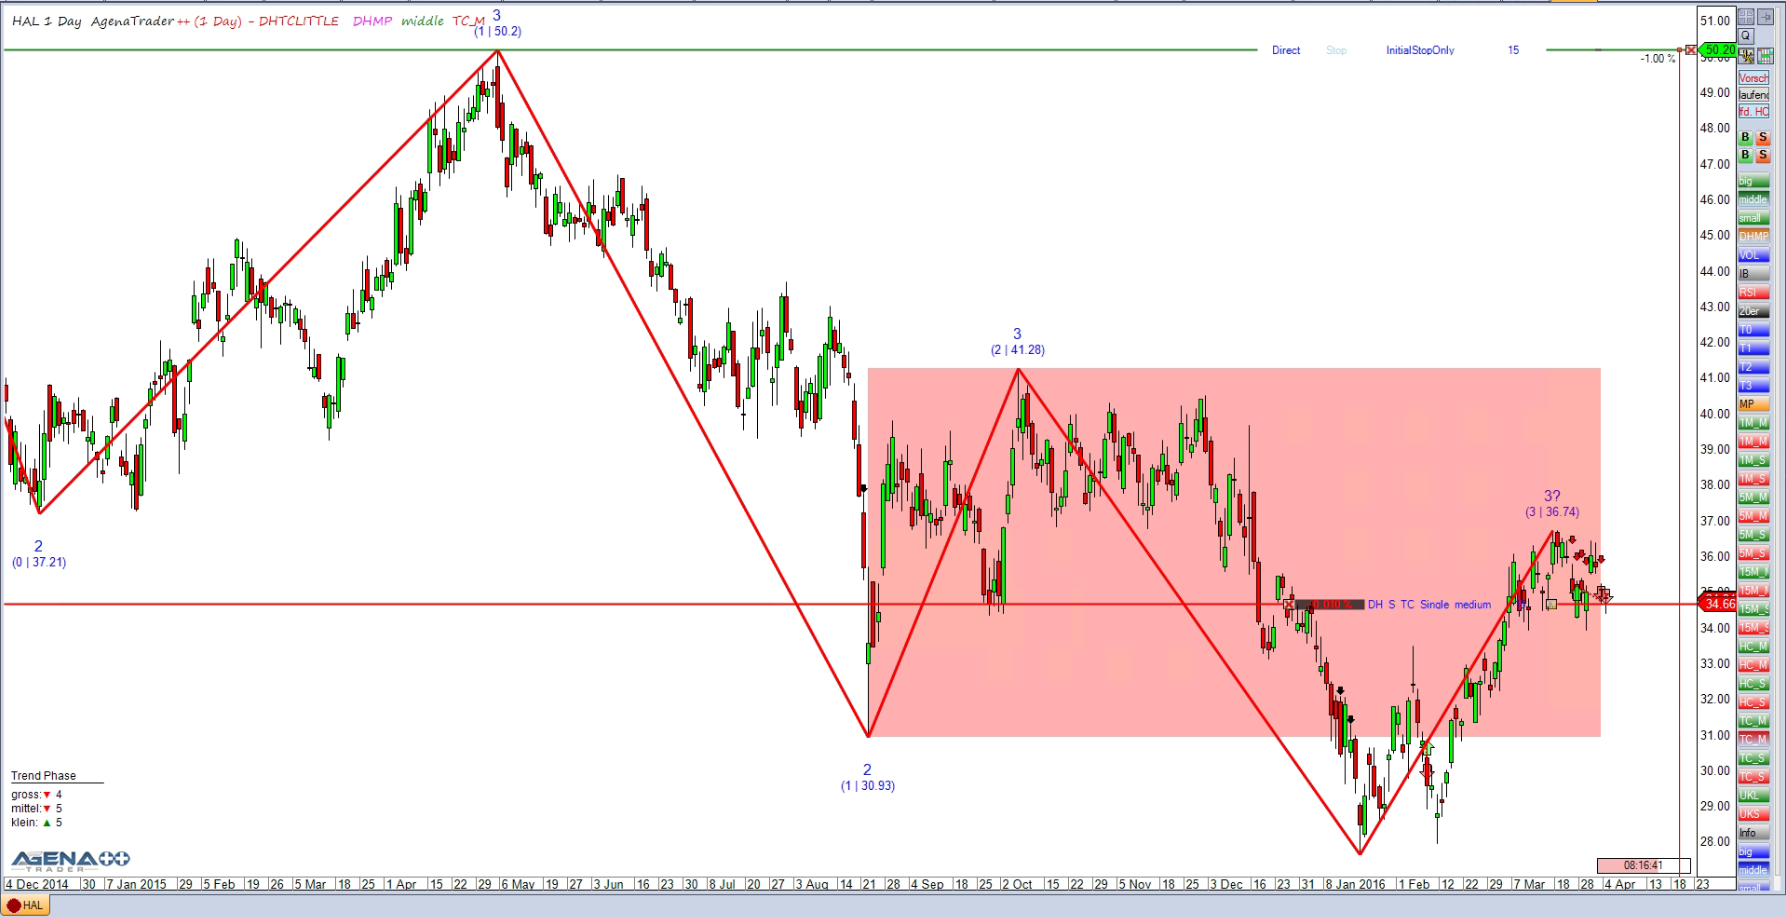
My short trade begins with today’s opening. I am trading the medium trend size here, and speculating on a trend continuation because – as Charles Dow argued – a trend continuation is more likely than a trend break, but only if the trend is not too mature yet. We will see if this trade works well.

For presentation purposes the trading software "AgenaTrader" has been used.
Disclaimer: Exchange transactions are associated with significant risks. Those who trade on the financial and commodity markets must familiarize themselves with these risks. Possible analyses, techniques and methods presented here are not an invitation to trade on the financial and commodity markets. They serve only for illustration, further education, and information purposes, and do not constitute investment advice or personal recommendations in any way. They are intended only to facilitate the customer's investment decision, and do not replace the advice of an investor or specific investment advice. The customer trades completely at his or her own risk. Please refer to the current version of the Terms and Conditions.
