HCP Inc (NYSE:HCP):
HCP Inc. (Health Care Property Investors) is an American real estate investor that is primarily active in the healthcare industry sector. The company acts as a self-regulatory real estate investment trust and purchases, develops, rents, sells and manages property.
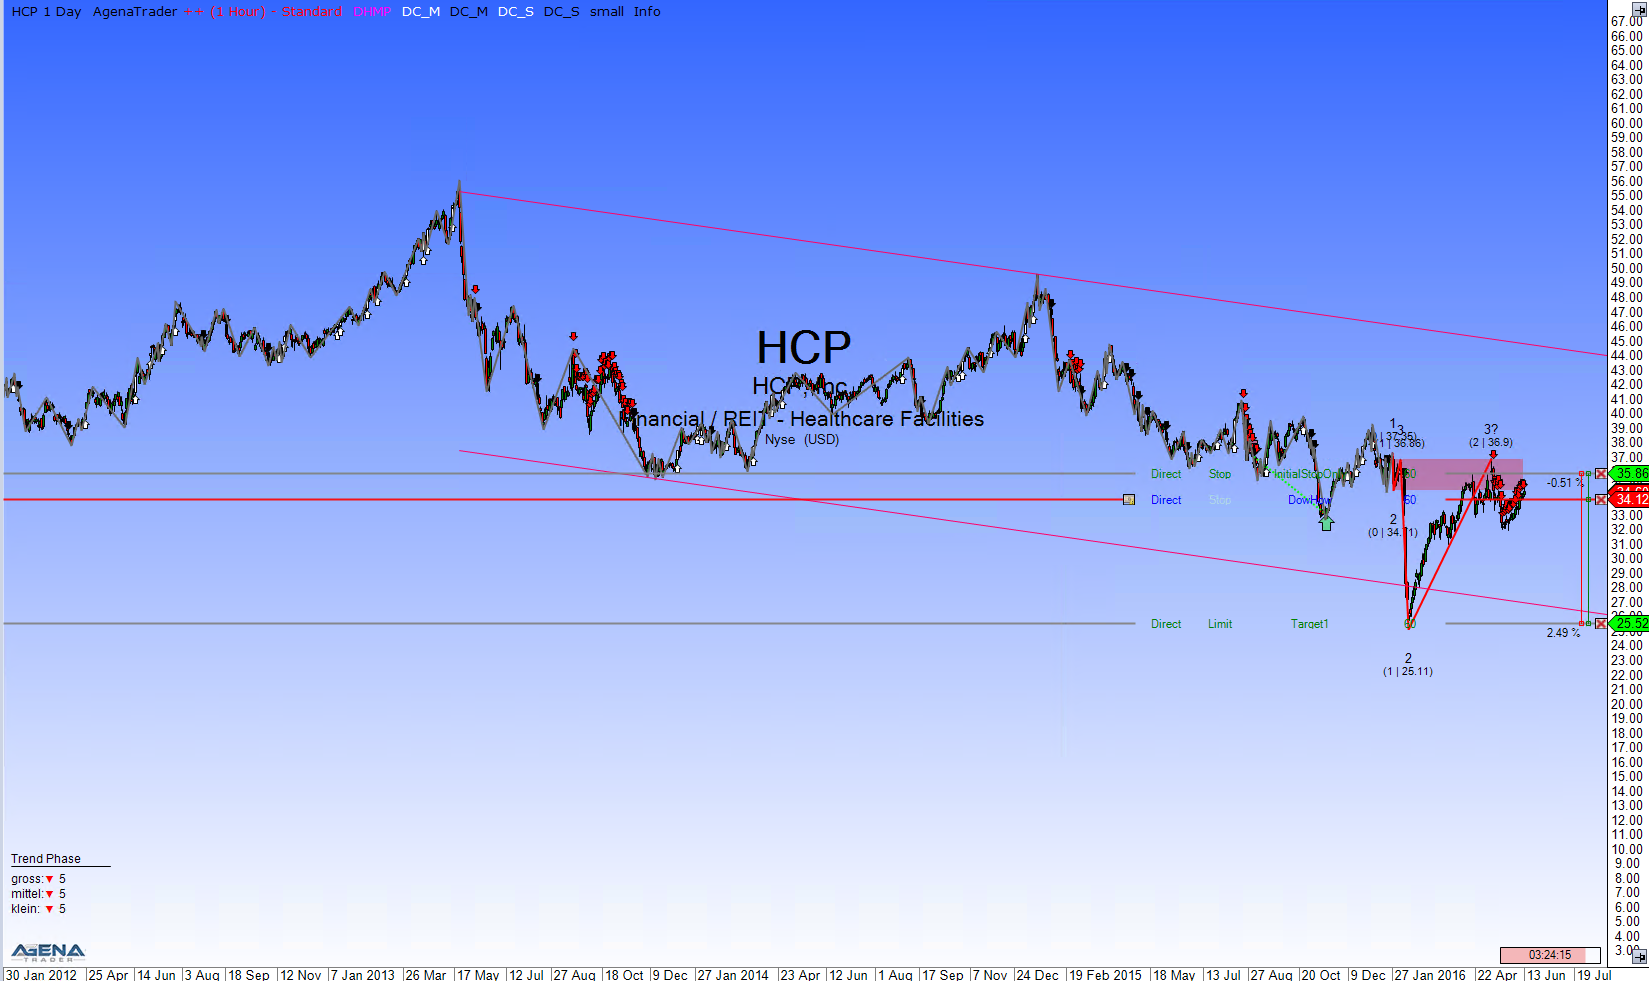
For three years now, this value has been in a permanent downtrend, as you can see from the trend channel. After the price was able to stabilize itself between $30 and $40, it is now showing a downtrend once again.
The last correction led the price exactly to the upper edge of the red correction zone, to then ricochet off downwards from there in a technically correct manner. The DowHow signal is now showing a nice short chance here. The target is located in the region of the lower trend channel line.

Allegheny Technologies Incorporated (NYSE:ATI):
Allegheny Technologies Incorporated is a US company specialized in metal production. With its offering, the company belongs to the largest manufacturers in the country. The company produces and distributes rust-free steel, nickel and titanium alloy, steel strip, steel plates, metal sheets, metal foils and tool steel.
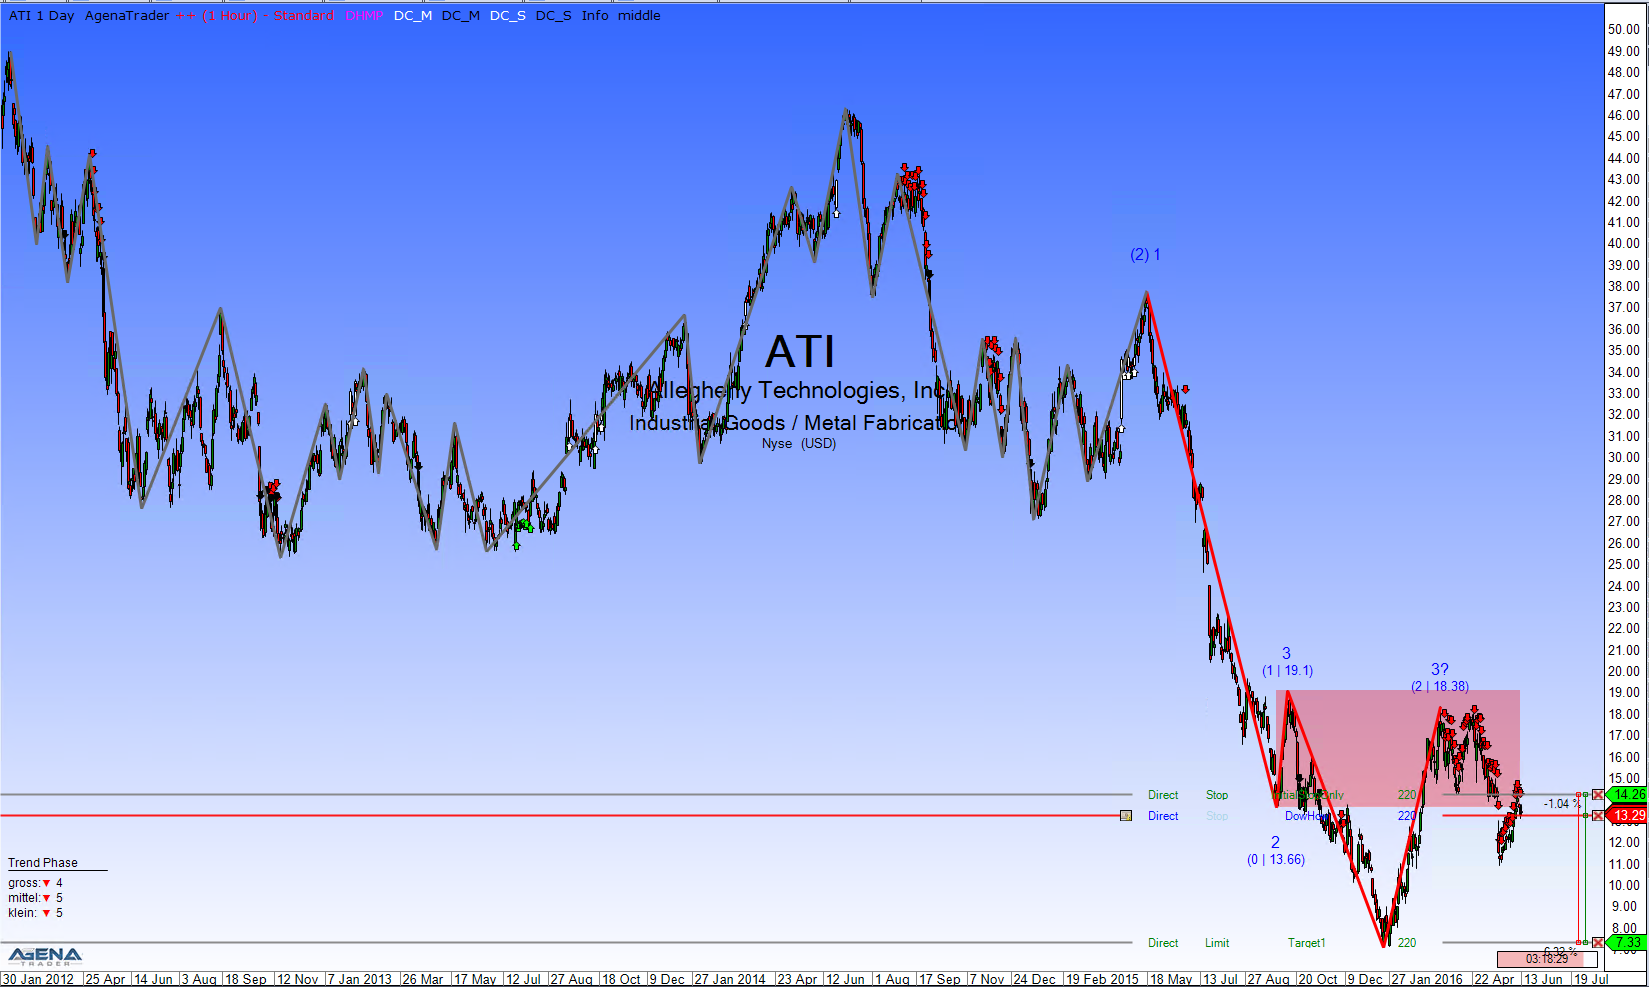
After the price formed a new low at $7.08, the value was able to correct very strongly, but then at $18 it no longer found any more buyers, and so it started a new downward movement. Two attempts to continue the trend have failed up until now, but the DowHow signal is now showing a third possibility. Perhaps it will be successful this time, since the signs are all pointing to short.
BB&T Corp (NYSE:BBT):
BB&T Corp. is a finance holding corporation with operative subsidiaries in all regions of the US. These subsidiaries are largely organized independently of the corporate group, and are set up communally.
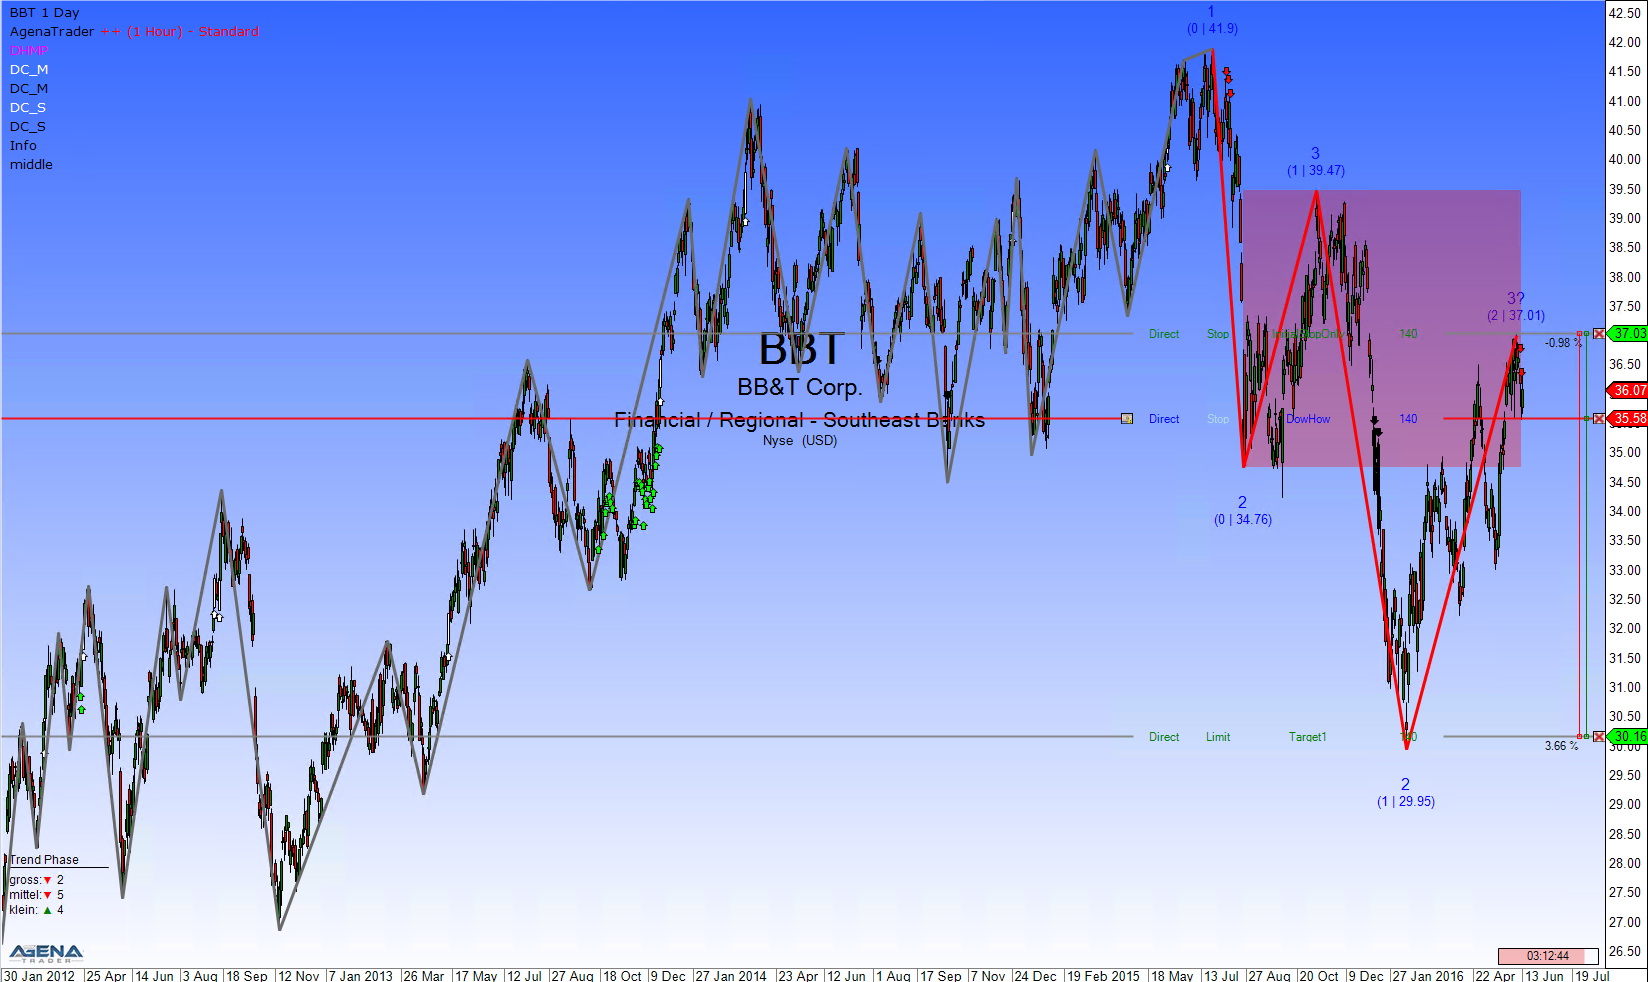
The price was able to stay at a high level for a long time, but at about $42, several tops disabused the buyers of the notion that it would continue onwards there. The fall that then followed was tremendous, and led to a return down to $29.95.
The recovery proceeded by means of a subordinate uptrend and led the price directly into the red correction zone. The DowHow signals are now indicating that the correction is possibly over, and that it is time for the next movement.
Freeport-McMoran Copper & Gold Inc (NYSE:FCX):
Freeport-McMoRan Copper & Gold Inc. is one of the worldwide leading gold and copper producers. The company operates via the subsidiary P.T. Freeport Indonesia, P.T. IRJA Eastern Minerals Corporation and Atlantic Copper.
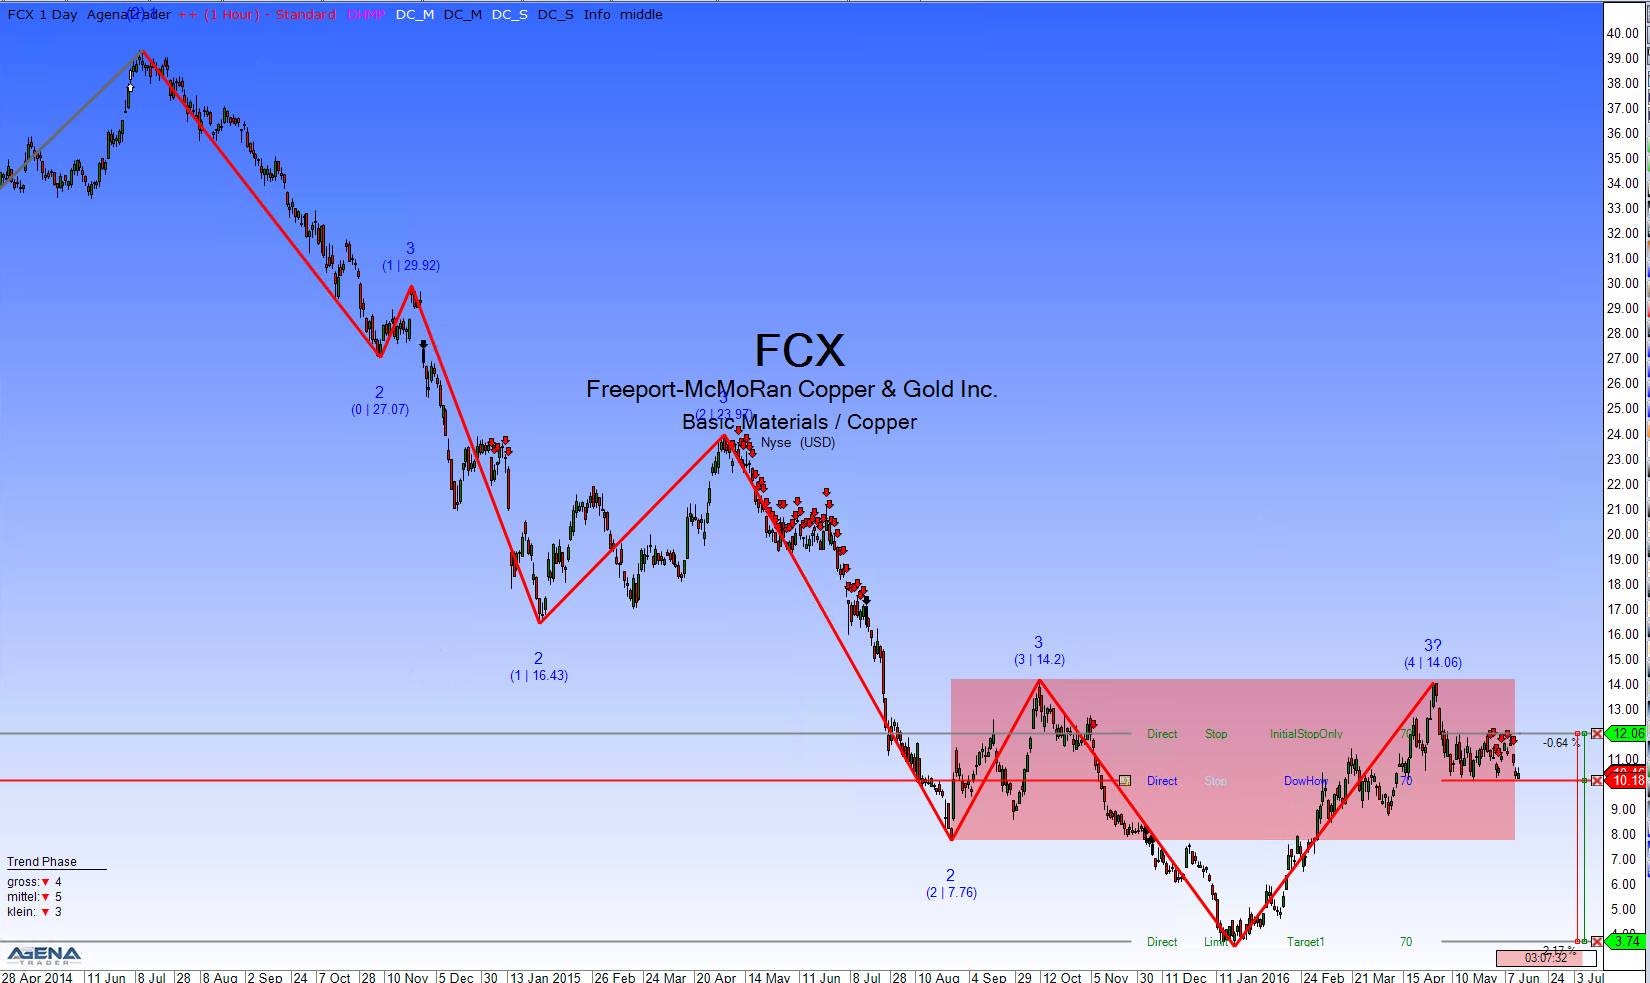
The existing trend here has already reached a certain maturity, because after all, the price was already more than three times as high once before. The last correction again led the price directly to the upper edge of the red correction zone. A surplus of sellers then caused a considerable decline and could now ring in a final downward movement. The DowHow signals, at least, are showing precisely this.
