Arista Networks (NYSE:ANET):
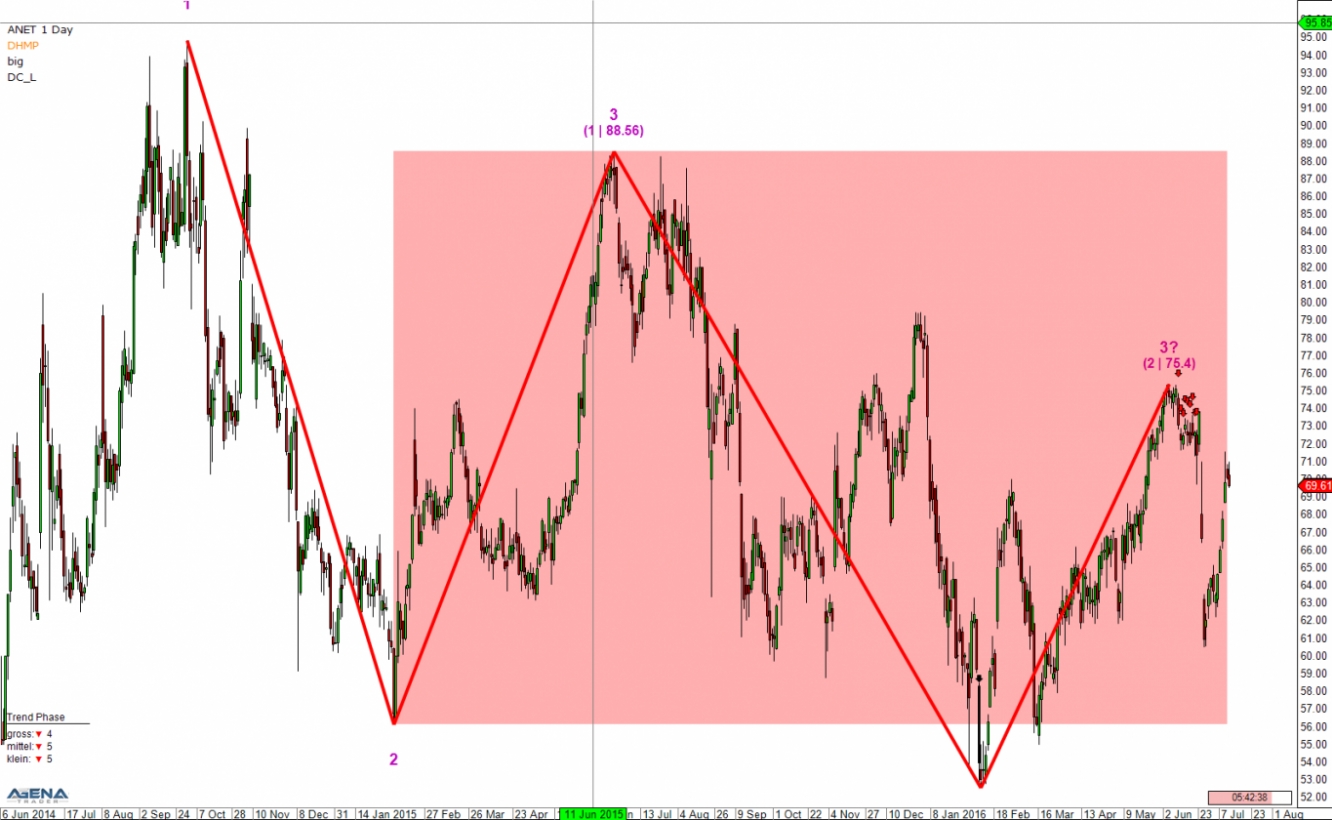
The Arista stock has been able to recover considerably since the beginning of the year, and achieved a temporary high of $75.40 at the start of June. Just at that point in time, an insider sold a large number of units within a short period of time. In approx. 4 weeks, Arista will publish the new quarterly figures. Significant weakness can already be seen in the chart, such that the DowHow setup is already showing a short signal again. There are two options here. Longer-term traders speculate on a trend continuation and have their stop above $88.56. Short-term oriented traders switch to the smaller trend sizes and try to cut out a nice slice of the cake on the way downwards.
Marriott International Inc (NASDAQ:MAR):
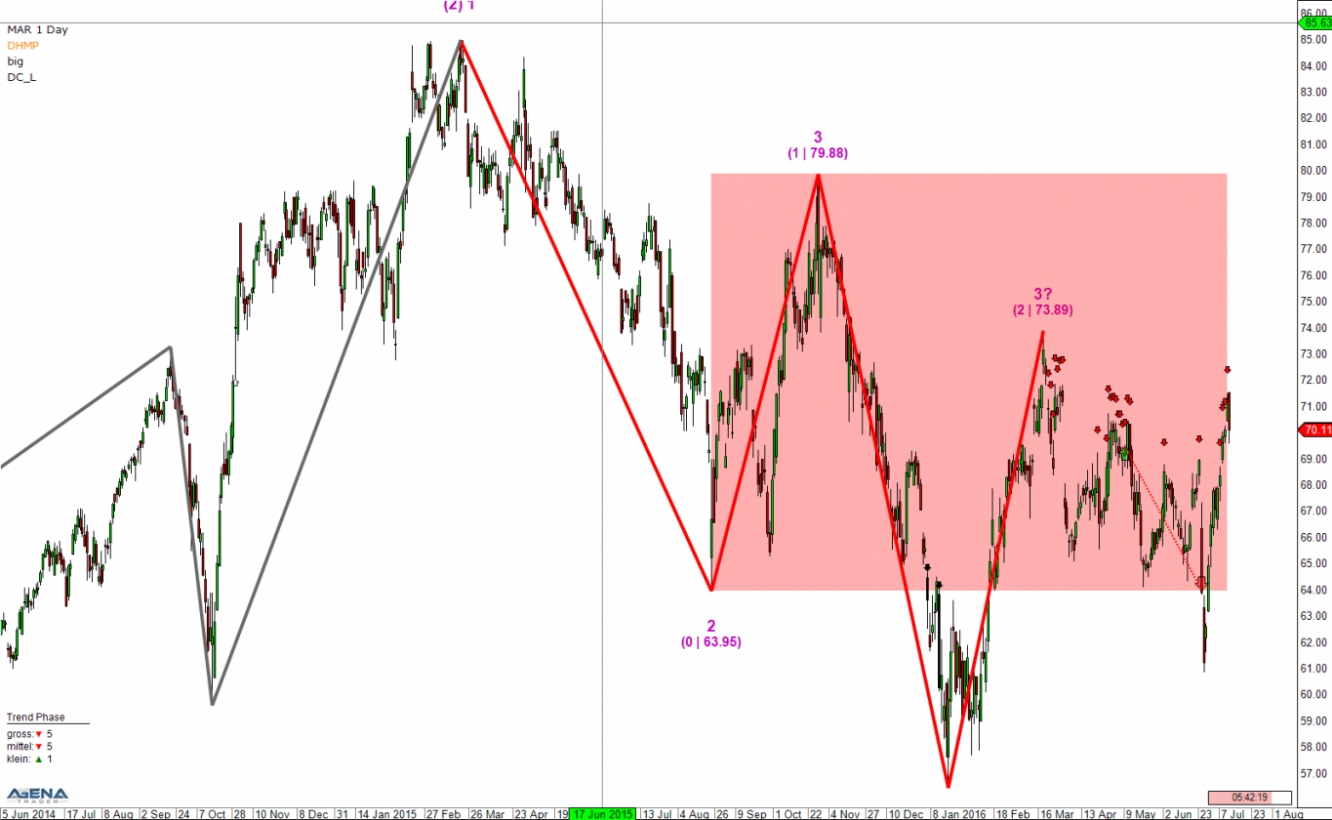
Marriott International Inc. (Marriott) is one of the largest hotel operators worldwide. Furthermore, the group is active as a franchisor and licensor for hotels, corporate housings and part-time apartments. Among the most well-known brands of the group are the Marriott Hotels & Resorts, Ritz Carlton and Bulgari Hotels & Resorts. In November 2015, the Marriott announced its intention to take over its competitor Starwood Hotels & Resorts Worldwide (NYSE:HOT). The acquisition is expected to be finalized in mid-2016. Whether Marriott’s speculation has backfired with this acquisition is anyone’s guess. In any case, the chart is showing very clear selling signals. The current correction zone runs between $63.95 and $79.88. After its last low at $56.43, the value was able to recover up to $73.89, and since then, our DowHow signal has been displaying clear selling chances. With a stop above the red box, one can speculate on a run-up to the last point two at $56.43.
Tesla (TSLA):
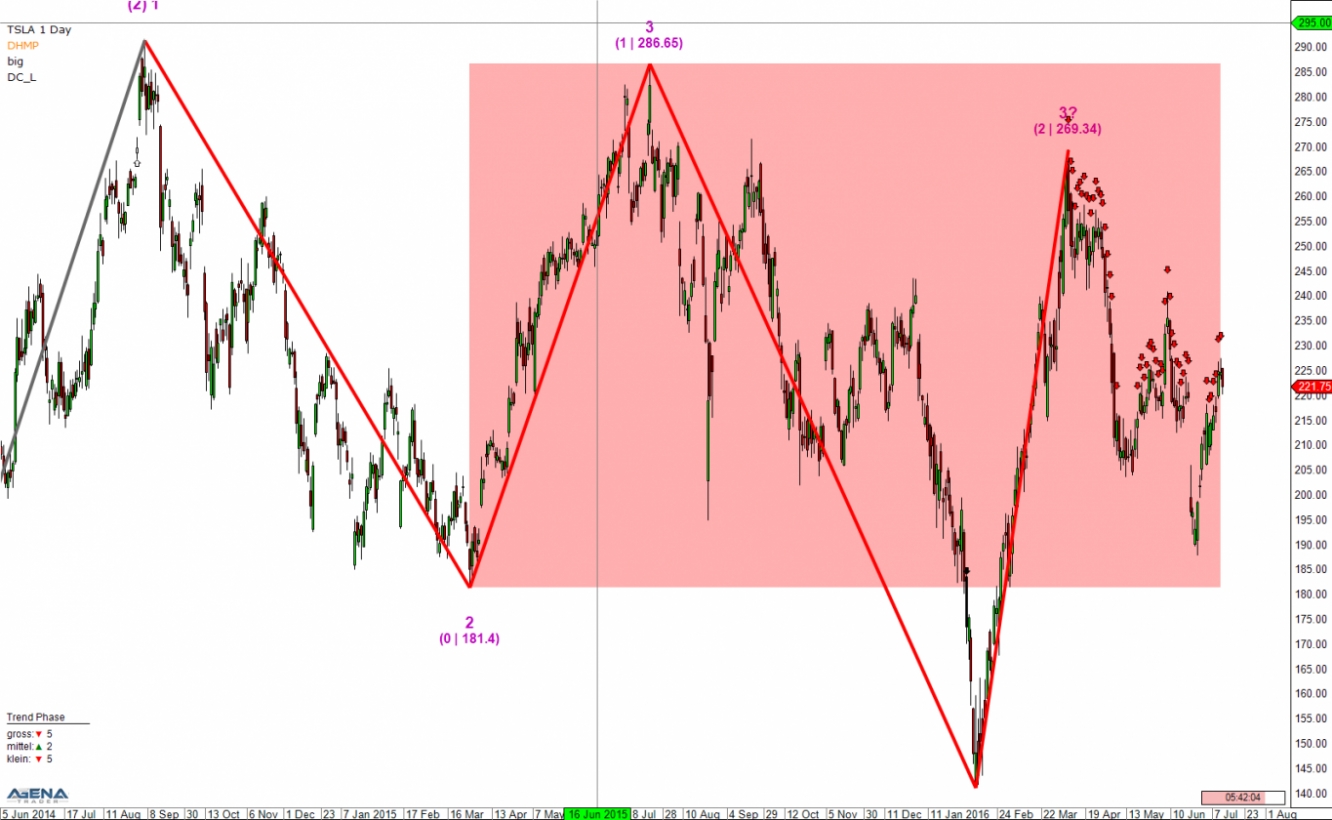
Tesla Motors Inc (NASDAQ:TSLA). develops and markets high-quality electric sports cars. In addition, the vehicle manufacturer also develops and produces electric drive components. But Tesla has recently been making negative headlines due to a fatal accident with one of its autopilot cars. However, the chart had already been pointing in the southerly direction for a long time beforehand. Since the last high at $269.34, the DowHow signals have been sending clear warning signals. After the last recovery, a new chance is now available to traders who are so-inclined to speculate on further slippage of the value. But careful, this value could still be shaken by many a piece of news.
IMPORTANT NOTE:
Exchange transactions are associated with significant risks. Those who trade on the financial and commodity markets must familiarize themselves with these risks. Possible analyses, techniques and methods presented here are not an invitation to trade on the financial and commodity markets. They serve only for illustration, further education, and information purposes, and do not constitute investment advice or personal recommendations in any way. They are intended only to facilitate the customer’s investment decision, and do not replace the advice of an investor or specific investment advice. The customer trades completely at his or her own risk.


