Two names today, one that reports after the close tonight Nike (NKE), and one before the open Friday, Blackberry (BBRY).
Nike, (NKE)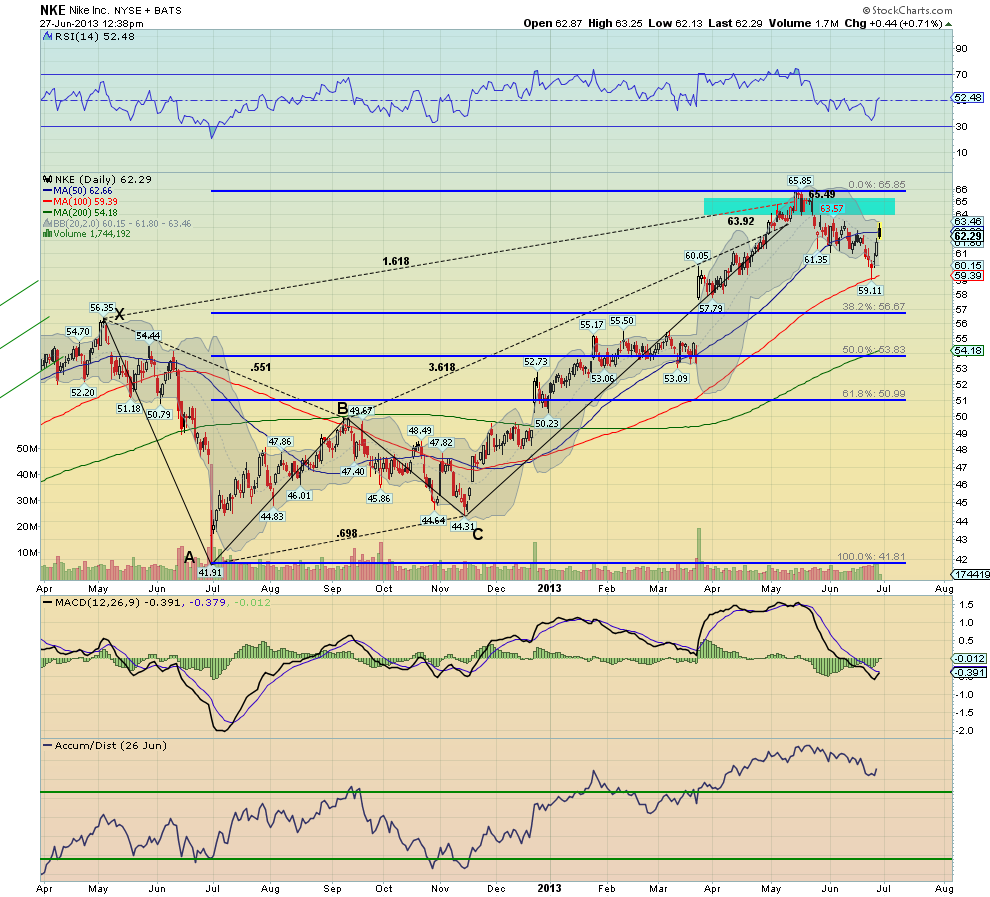
Nike is moving higher after touching the 100 day Simple Moving Average (SMA). The volume on th move up is good but the gapping candles are a little troublesome. The Relative Strength Index (RSI) is pushing through the mid line higher towards bullish territory with the Moving Average Convergence Divergence (MACD) indicator turning up, and the accum/dist showing accumulation, all pointing to an upside bias.
Resistance higher is found at 63.50 and 64.25 followed by 65.50 and 65.85. Support lower cones at 61.40 and 60, and note that the price still has not met the first target lower form the Crab at 56.67. The reaction to the last 6 earnings reports has been a move of about 5.67% on average or $3.53 making for an expected range of 58.70 to 65.80. The at-the-money June weekly Straddles suggest a smaller $3.15 move by Expiry tomorrow with Implied Volatility at 110% in line with the July at 30% and August at 27%. Options action saw 1600 June 62.5/60 Put Spreads trade this morning on the offer as well as some July Call buying.
Trade Idea 1: Buy the June 65 Calls for $0.58.
Trade Idea 2: Buy the June/July 65 Call Calendars for $0.40.
Trade Idea 3: Buy the July5 65 Calls for $0.71.
Trade Idea 4: Sell the July 57.5 Puts for a $0.55 credit.
Trade Idea 5: Buy the June/July 65 Call Calendars selling the July 57.5 Puts for a $0.15 credit.
Trade Idea 6: Buy the June/July 65 Call Calendars selling the July5/July 57.5 Puts for $0.20.
Blackberry, (BBRY)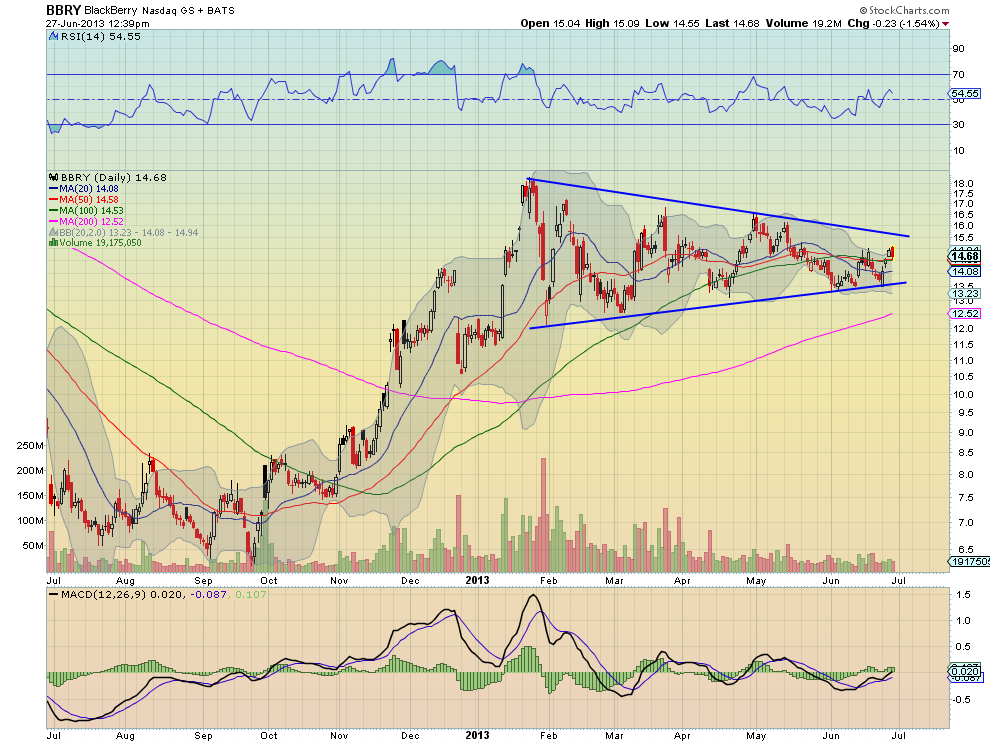
Blackberry is moving in a 6 month long symmetrical triangle, ever tightening. Today sees it building a bearish engulfing candle early, just above the flat SMA’s. The RSI is on the verge of moving into bullish territory with the MACD indicator turning up. A short term upside bias. Support lower comes first at 14 and 13.50 before 12.60 and 12.15. under 13.50 carries a Measured Move (MM) lower to 7.50. There is resistance at 15 and 16 followed by 16.50, 17.20 before 18.20. Over 15.50 the MM higher is to 21.50.
The reaction to the last 6 earnings reports has been a move of about 12.03% on average or $1.81 making for an expected range of 12.75 to 16.50. And short interest is very high at 35%. The at-the money June weekly Straddles suggest a similar $1.70 move by Expiry with Implied Volatility at 250% well above the July monthly at 83% and the August at 67%. Options volume favors the upside with 8,333 September 17/18 Call Spreads trading on the offer, and 1000 August 25 bullish risk reversals.
Trade Idea 1: Buy the June 15/16 Call Spread and sell next weeks 12.5 Put for a $0.03 credit.
Trade Idea 2: Buy the August 15 Straddle selling the July5 14/15.5 Strangle for $1.60.
Trade Idea 3: Buy the June 15/July5 16 Call Spread and sell July5 12 Put for $0.05 .
Trade Idea 4: Buy the July5 15/16 Call Spread and sell the July5 12.5 Put for a $0.10.
The information in this blog post represents my own opinions and does not contain a recommendation for any particular security or investment. I or my affiliates may hold positions or other interests in securities mentioned in the Blog, please see my Disclaimer page for my full disclaimer.
Original post
- English (UK)
- English (India)
- English (Canada)
- English (Australia)
- English (South Africa)
- English (Philippines)
- English (Nigeria)
- Deutsch
- Español (España)
- Español (México)
- Français
- Italiano
- Nederlands
- Português (Portugal)
- Polski
- Português (Brasil)
- Русский
- Türkçe
- العربية
- Ελληνικά
- Svenska
- Suomi
- עברית
- 日本語
- 한국어
- 简体中文
- 繁體中文
- Bahasa Indonesia
- Bahasa Melayu
- ไทย
- Tiếng Việt
- हिंदी
Trade Ideas For Nike And Blackberry
Published 06/27/2013, 04:18 PM
Updated 05/14/2017, 06:45 AM
Trade Ideas For Nike And Blackberry
Latest comments
Loading next article…
Install Our App
Risk Disclosure: Trading in financial instruments and/or cryptocurrencies involves high risks including the risk of losing some, or all, of your investment amount, and may not be suitable for all investors. Prices of cryptocurrencies are extremely volatile and may be affected by external factors such as financial, regulatory or political events. Trading on margin increases the financial risks.
Before deciding to trade in financial instrument or cryptocurrencies you should be fully informed of the risks and costs associated with trading the financial markets, carefully consider your investment objectives, level of experience, and risk appetite, and seek professional advice where needed.
Fusion Media would like to remind you that the data contained in this website is not necessarily real-time nor accurate. The data and prices on the website are not necessarily provided by any market or exchange, but may be provided by market makers, and so prices may not be accurate and may differ from the actual price at any given market, meaning prices are indicative and not appropriate for trading purposes. Fusion Media and any provider of the data contained in this website will not accept liability for any loss or damage as a result of your trading, or your reliance on the information contained within this website.
It is prohibited to use, store, reproduce, display, modify, transmit or distribute the data contained in this website without the explicit prior written permission of Fusion Media and/or the data provider. All intellectual property rights are reserved by the providers and/or the exchange providing the data contained in this website.
Fusion Media may be compensated by the advertisers that appear on the website, based on your interaction with the advertisements or advertisers.
© 2007-2024 - Fusion Media Limited. All Rights Reserved.