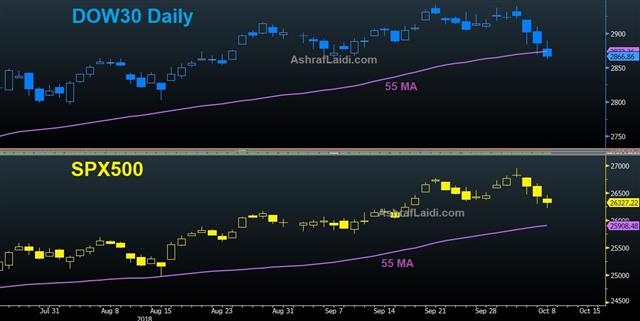
US indices join their European counterparts in extending selling below Friday's levels on a combination of Italy deficit concerns and the overall spike in global bond yields. Non-farm payrolls on Friday stole the headlines but at the same time the US August trade balance report was issued and that part of the economy is the one to watch. The yen is the strongest performer of the day, dragging USD to 113. Keep an eye on the fact that SPX is testing its 55-DMA, while the DOW30 is 1.3% above its own 55-DMA, possibly implying that 25950 will be seen on the DOW30.

The US trade deficit rose to $53.2 billion in August from $50.0B in July. The bilateral deficit with China was at $34.4 billion. In the months ahead, this number could expand further and draw the ire of the White House. One reason for a jump in growth in Q2 was a surge in soybean exports to beat the tariffs. There may be similar moves in Q3 as electronics companies reported stockpiling.
Signs are growing that it will reverse late in the year. US soybeans are a major export and the selling season typically runs from Aug-February. In August, exports to China fell to nearly nothing from a typical amount of $550 million. By Oct/Nov the monthly rate usually rises to $2.5 billion. As that dries up it will further dent the deficit. Of course, farmers could export elsewhere, but they could also grow inventories.
The risk is that's just one area where US exports suffer. In addition, the US is also operating at full capacity. NAFTA stockpiling could also reverse and lead to other distortions. In short, economists have poor accessibility and insight into how trade flows have been disrupted and will affect the economy. Surprises are coming, especially in real time data and the risk is that the result is a weaker economy and a more-aggressive White House. This could also drive the USD rhetoric from the White House ahead of the mid-term elections...as it did 8 months ago.
Looking towards the new week of trading, Japan, Canada and the US start the week with holidays so trading may be light.
CFTC Commitments of Traders
Speculative net futures trader positions as of the close on Tuesday. Net short denoted by - long by +.
EUR -7K vs +4K prior GBP -59K vs -67K prior JPY -114K vs -85K prior CHF -13K vs -16K prior CAD -19K vs -20K prior AUD -72K vs -72K prior NZD -31K vs -32K prior.
The aggressive yen selling is somewhat jarring. An already-crowded trade moved into extreme territory, undoubtedly as a result of bond yields breaking above resistance. The worry is that this leaves little speculative fuel left for the big move that many are betting on.
AUD shorts, meanwhile, continue to be rewarded with fresh lows dating back to 2016 and 0.7000 under threat.
