Get 40% Off
🚨 Volatile Markets? Find Hidden Gems for Serious Outperformance
Find Stocks Now

Trade Balance Up 1.2B From Revised April Headline

Published 07/08/2015, 12:31 AM
Updated 07/09/2023, 06:31 AM

Here we introduce the monthly report, International Trade in Goods and Services, also known as the FT-900. Data is published monthly by the Bureau of Economic Analysis with revisions that go back several months, with data going back to 1992. This report details U.S. exports and imports of goods and services.

The Bretton Woods agreement, which established a stable foreign currency exchange system (as well as created the International Monetary Fund), collapsed in 1971 and as a result, currency values began to float freely and the US dollar was no longer tied to gold values. Since 1976, the United States has had an annual negative trade deficit.

Here is an excerpt from the report:

The U.S. Census Bureau and the U.S. Bureau of Economic Analysis, through the Department of Commerce, announced today that the goods and services deficit was $41.9 billion in May, up $1.2 billion from $40.7 billion in April, revised. May exports were $188.6 billion, $1.5 billion less than April exports. May imports were $230.5 billion, $0.3 billion less than April imports.

The May increase in the goods and services deficit reflected a increase in the goods deficit of $1.2 billion to $61.5 billion and an increase in the services surplus of less than $0.1 billion to $19.6 billion.

Year-to-date, the goods and services deficit increased $1.1 billion, or 0.5 percent, from the same period in 2014. Exports decreased $26.5 billion or 2.7 percent. Imports decreased $25.4 billion or 2.2 percent.

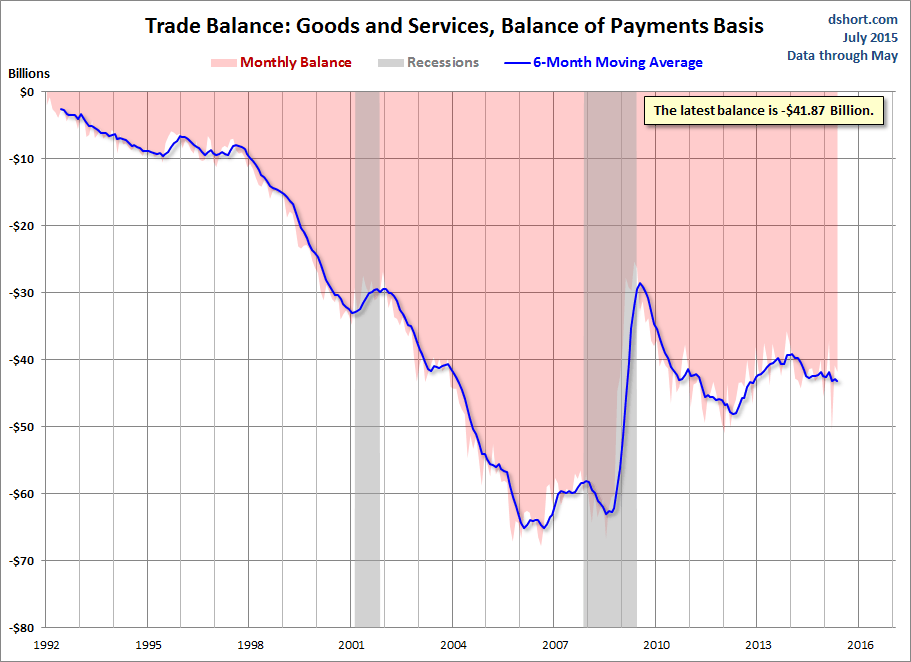
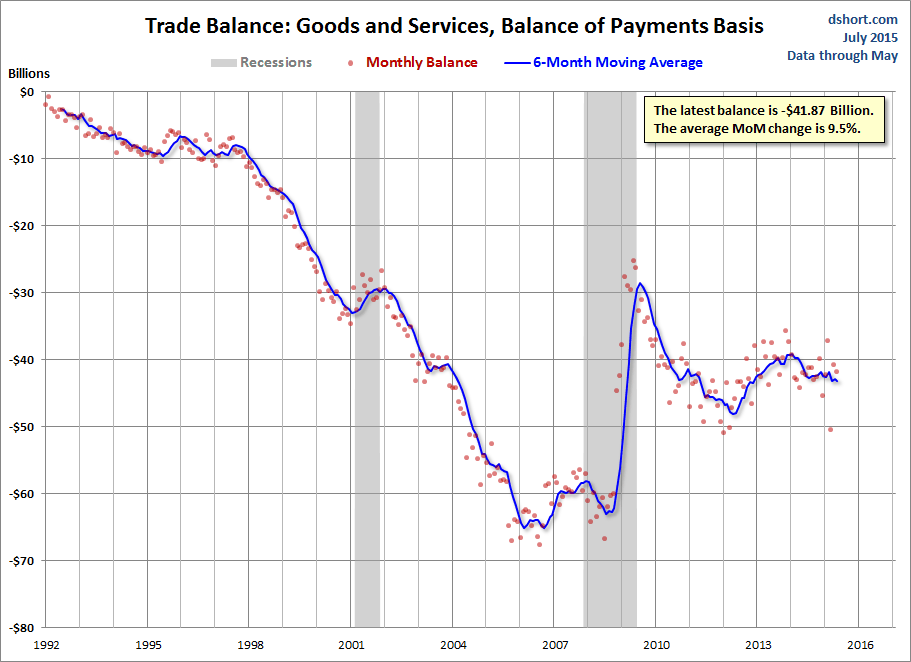
This series tends to be extremely volatile, so we use a six-month moving average. Today's headline number of -41.87B was better than the Investing.com forecast of -42.60B.
3rd party Ad. Not an offer or recommendation by Investing.com. See disclosure here or remove ads .

Trade Balance: Goods and Services, Balance of Payments Basis

Here is a snapshot that gives a better sense of the extreme volatility of this indicator.
Trade Balance

Latest comments

Risk Disclosure: Trading in financial instruments and/or cryptocurrencies involves high risks including the risk of losing some, or all, of your investment amount, and may not be suitable for all investors. Prices of cryptocurrencies are extremely volatile and may be affected by external factors such as financial, regulatory or political events. Trading on margin increases the financial risks.
Before deciding to trade in financial instrument or cryptocurrencies you should be fully informed of the risks and costs associated with trading the financial markets, carefully consider your investment objectives, level of experience, and risk appetite, and seek professional advice where needed.
Fusion Media would like to remind you that the data contained in this website is not necessarily real-time nor accurate. The data and prices on the website are not necessarily provided by any market or exchange, but may be provided by market makers, and so prices may not be accurate and may differ from the actual price at any given market, meaning prices are indicative and not appropriate for trading purposes. Fusion Media and any provider of the data contained in this website will not accept liability for any loss or damage as a result of your trading, or your reliance on the information contained within this website.
It is prohibited to use, store, reproduce, display, modify, transmit or distribute the data contained in this website without the explicit prior written permission of Fusion Media and/or the data provider. All intellectual property rights are reserved by the providers and/or the exchange providing the data contained in this website.
Fusion Media may be compensated by the advertisers that appear on the website, based on your interaction with the advertisements or advertisers.
© 2007-2024 - Fusion Media Limited. All Rights Reserved.