Here are the Rest of the Top 10:
Bank of New York Mellon, Ticker: BK
Bank of New York Mellon, (BK), is making new highs and breaking resistance as it moves up out of a ‘W’ pattern. The Relative Strength Index (RSI) is rising and bullish and the MACD is also moving higher, both supporting more upside.
Costco, Ticker: COST
Costco, (COST), has been one of my tells on the market in general. It has been moving in a broad channel between 110 and 120 since August, much like how the broad market has made slightly higher highs and then pulled back. Now at resistance after making a higher low it has support for more upside from a rising and bullish RSI and a MACD driving higher.
Kansas City Southern, Ticker: KSU
Kansas City Southern, (KSU), broke above resistance at 119 and moved as high at 125. Now pulling back slightly in a bull flag it has a RSI that has worked off the technically overbought condition and remains bullish with a MACD that is level.
Mastercard, Ticker: MA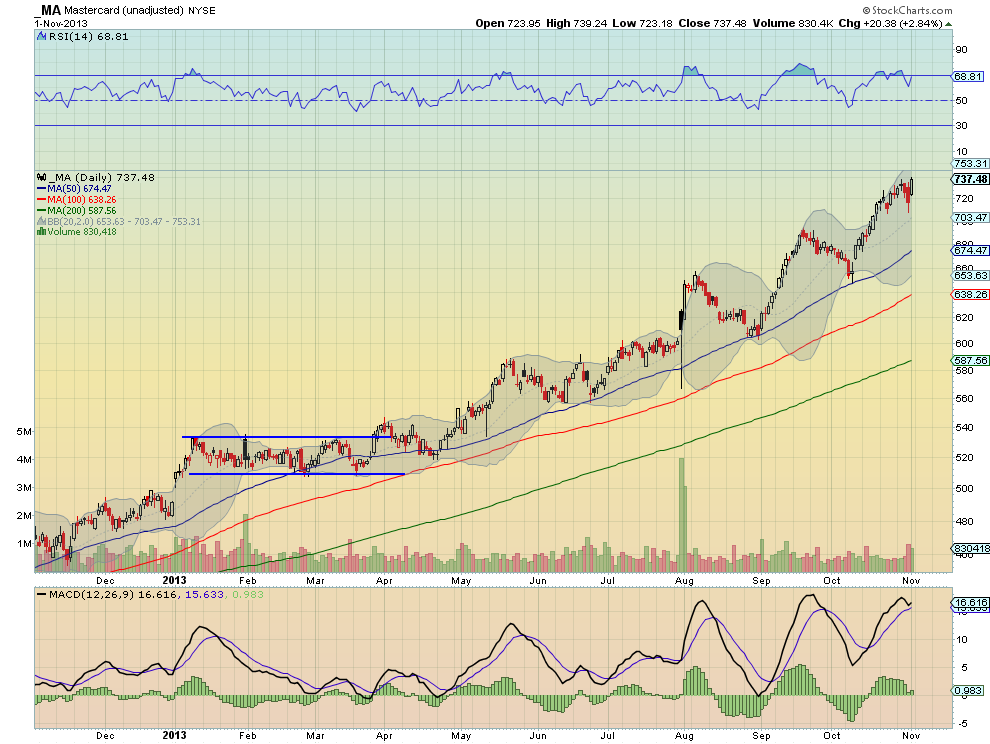
Mastercard, (MA), pulled back for one day after reporting earnings Thursday morning. Now at new all time highs it may be breaking consolidation higher for another run. The RSI is moving back higher after pulling back from a technically overbought condition and the MACD is also turning back higher. Both are elevated though.
Yahoo, Ticker: YHOO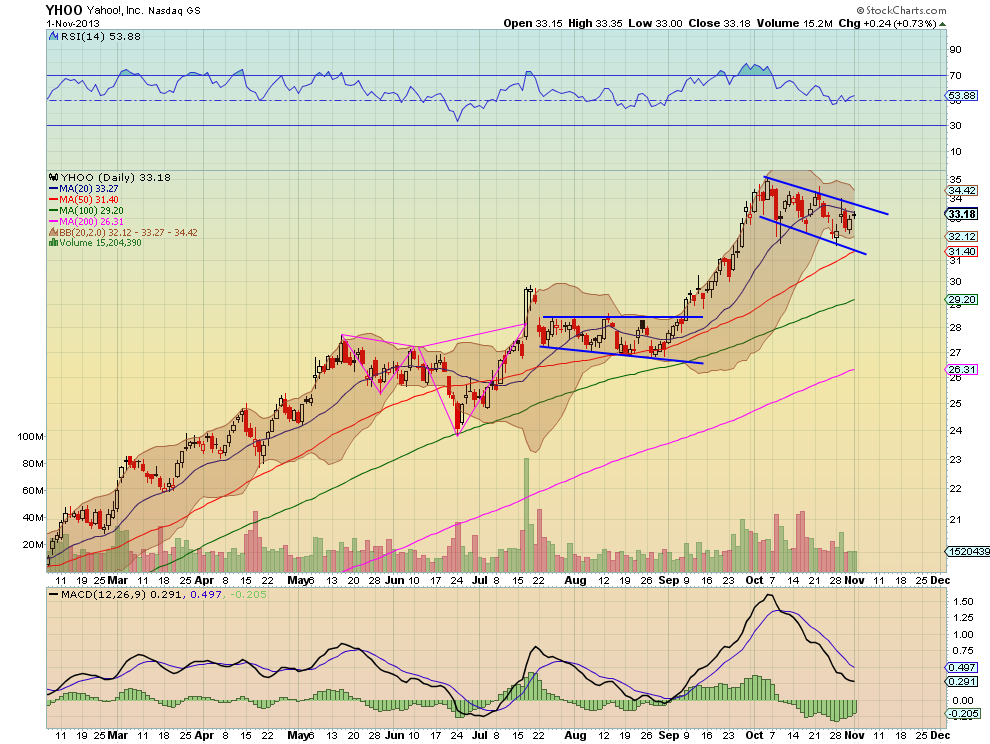
Yahoo, (YHOO), has built a loose bull flag after a move higher and is testing the upper rail of it. The RSI has pulled back to the mid line and is holding with a MACD that is starting to round and showing improvement on the histogram.
After reviewing over 1,000 charts, I have found some good setups for the week. These were selected and should be viewed in the context of the broad Market Macro picture reviewed Friday which, heading into the last 2 months of the year sees the markets still looking positive but maybe in need of a short term pullback. Look for Gold and Crude Oil to continue lower. The US Dollar Index wants to move higher while US Treasuries are biased lower. The Shanghai Composite may consolidate but it and Emerging Markets are biased to the downside. Volatility looks to remain subdued keeping the bias higher for the equity index ETF’s SPY, IWM and QQQ. Their charts suggest a possible pullback continuing for the IWM, with the QQQ possibly joining it and the SPY consolidating but maybe ready to reverse higher again. Use this information as you prepare for the coming week and trad’em well.
Disclosure: The information in this blog post represents my own opinions and does not contain a recommendation for any particular security or investment. I or my affiliates may hold positions or other interests in securities mentioned in the Blog, please see my Disclaimer page for my full disclaimer.
Original post
- English (UK)
- English (India)
- English (Canada)
- English (Australia)
- English (South Africa)
- English (Philippines)
- English (Nigeria)
- Deutsch
- Español (España)
- Español (México)
- Français
- Italiano
- Nederlands
- Português (Portugal)
- Polski
- Português (Brasil)
- Русский
- Türkçe
- العربية
- Ελληνικά
- Svenska
- Suomi
- עברית
- 日本語
- 한국어
- 简体中文
- 繁體中文
- Bahasa Indonesia
- Bahasa Melayu
- ไทย
- Tiếng Việt
- हिंदी
Top Trade Ideas- Week Of November 4: BK, COST, KSU, MA, YHOO
Published 11/04/2013, 12:16 AM
Updated 05/14/2017, 06:45 AM
Top Trade Ideas- Week Of November 4: BK, COST, KSU, MA, YHOO
3rd party Ad. Not an offer or recommendation by Investing.com. See disclosure here or
remove ads
.
Latest comments
Install Our App
Risk Disclosure: Trading in financial instruments and/or cryptocurrencies involves high risks including the risk of losing some, or all, of your investment amount, and may not be suitable for all investors. Prices of cryptocurrencies are extremely volatile and may be affected by external factors such as financial, regulatory or political events. Trading on margin increases the financial risks.
Before deciding to trade in financial instrument or cryptocurrencies you should be fully informed of the risks and costs associated with trading the financial markets, carefully consider your investment objectives, level of experience, and risk appetite, and seek professional advice where needed.
Fusion Media would like to remind you that the data contained in this website is not necessarily real-time nor accurate. The data and prices on the website are not necessarily provided by any market or exchange, but may be provided by market makers, and so prices may not be accurate and may differ from the actual price at any given market, meaning prices are indicative and not appropriate for trading purposes. Fusion Media and any provider of the data contained in this website will not accept liability for any loss or damage as a result of your trading, or your reliance on the information contained within this website.
It is prohibited to use, store, reproduce, display, modify, transmit or distribute the data contained in this website without the explicit prior written permission of Fusion Media and/or the data provider. All intellectual property rights are reserved by the providers and/or the exchange providing the data contained in this website.
Fusion Media may be compensated by the advertisers that appear on the website, based on your interaction with the advertisements or advertisers.
© 2007-2024 - Fusion Media Limited. All Rights Reserved.