There is currently an expanding list of 24 ETFs oriented to the utility and infrastructure sector with more on the way. The following analysis features a fair representation of ETFs available. We believe investors may choose from this list an appropriate ETF to satisfy the best index-based offerings available.
The Conservative End
Utility investments are at the conservative end of investing. Most investors buy them for the steady dividends and lower market volatility. This feature hasn’t changed much.
Currently, utilities are under significant regulatory and macro-economic pressure. From a regulatory point of view, most utilities need a more contemporary grid, but the climate is uncertain given a wide variety of local issues.
Power issues
Atop this are fuel issues including whether to upgrade older plants with cheap and readily available coal, natural gas, oil or nuclear. Hydro-electric systems seem completely stopped from an environmental view and most available sources have been tapped. Nuclear power seems safe enough for new plants but with an old Fukushima plant and disaster in the publics’ mind, these unfortunately seem an unlikely source. Oil powered utilities are more acceptable but fuel costs are high. Alternative (green) energy is still unavailable in the amount necessary and are more costly. The best bet is natural gas, which utilities are moving toward and away from coal where possible.
Another drag on public utilities is the economic climate. When the economy slows, power use drops as too. Perhaps the best example is the high number of vacant homes in the U.S. currently with unused meters.
ETFs are based on indexes tied to well-known index providers including Russell, S&P, Barclays, MSCI, Dow Jones, Wisdom Tree, PowerShares, EG Shares and so forth. Also included are some so-called “enhanced” indexes that attempt to achieve better performance through more active management of the index. Investors should note the holdings we have listed and compare one issue to another with that in mind.
ETFs are based on indexes tied to well-known index providers including Russell, S&P, Barclays, MSCI, Dow Jones and so forth. Also included are some so-called “enhanced” indexes that attempt to achieve better performance through more active management of the index.
Positioning
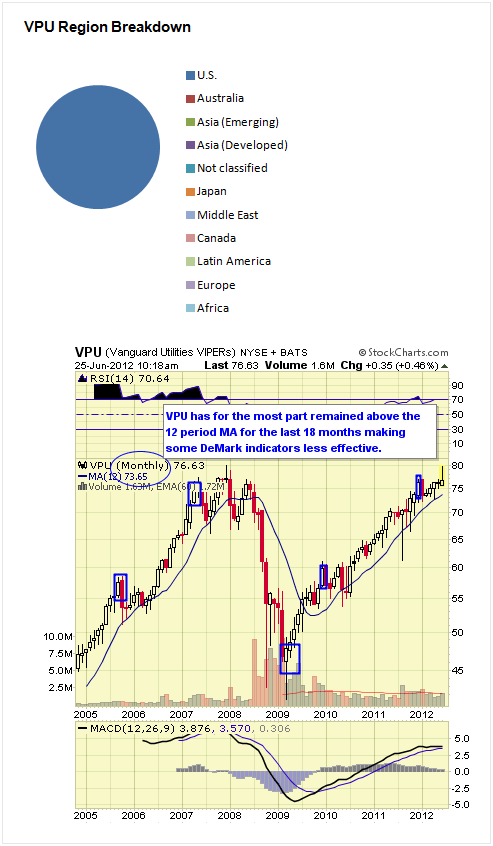
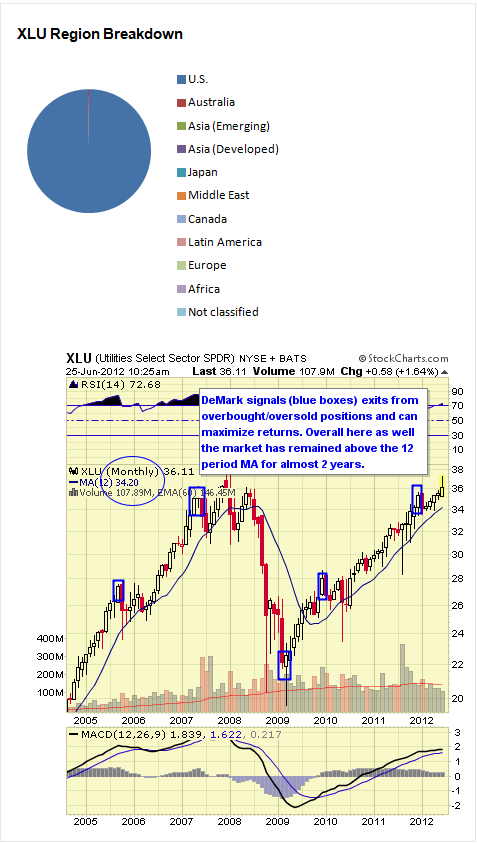
We feature a technical view of conditions from monthly chart views. Simplistically, we recommend longer-term investors stay on the right side of the 12-month simple moving average. When prices are above the moving average, stay long, and when below remain in cash or short. Premium members to the ETF Digest receive added signals when markets become extended such as DeMark triggers to exit overbought/oversold conditions.
Hedge Issues
For traders and investors wishing to hedge, leveraged and inverse issues are available to utilize from ProShares and where available these are noted.
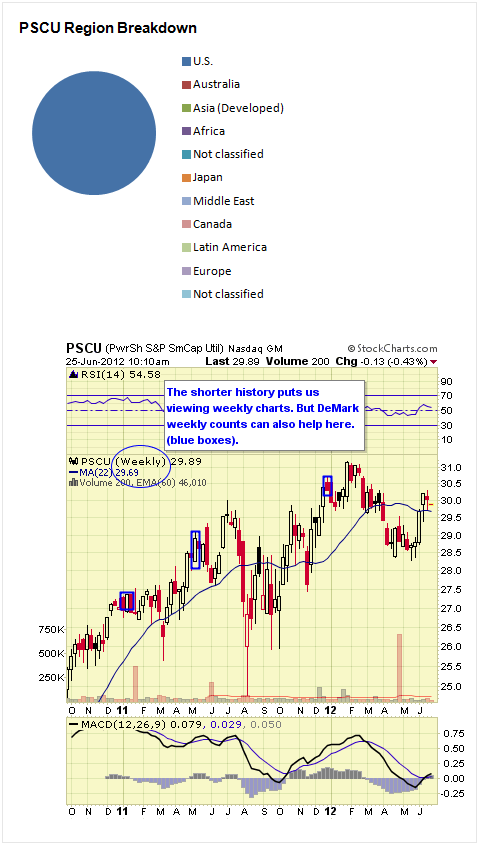
PSCU follows the S&P SmallCap 600 Utilities Index which takes the SmallCap 600 utility equity components to form the index. The fund was launched in April 2010. The expense ratio is 0.29%. AUM equal $28M and average daily trading volume is 14K shares.
As of June 2012 the annual dividend yield was 3.18% and YTD return -0.87%. The one year return was 7.13%.
Data as of June 2012
PSCU Top Ten Holdings and Weightings:
- Piedmont Natural Gas Company (PNY): 9.71%
- Southwest Gas Corporation (SWX): 8.53%
- New Jersey Resources Corporation (NJR): 7.90%
- UIL Holdings Corporation (UIL): 7.65%
- South Jersey Industries (SJI): 6.56%
- Avista Corporation (AVA): 4.94%
- NorthWestern Corporation (NWE): 4.69%
- Northwest Natural Gas (NWN): 4.65%
- ALLETE, Inc. (ALE): 4.60%
- CH Energy Group Inc (CHG): 4.59%

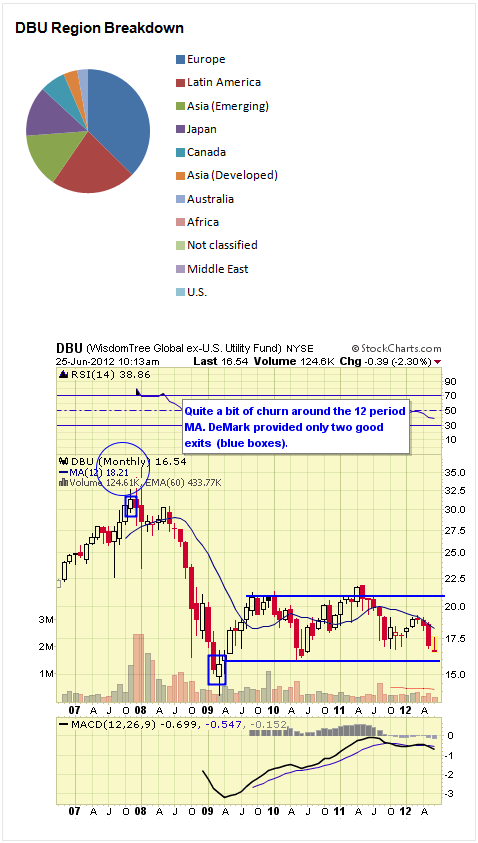
DBU follows the WisdomTree Global ex-US Utility Index which follows utility equities from emerging and developed countries with the top 100 by market capitalization included in the index. The fund was launched in October 2006. The expense ratio is 0.58%. AUM equal $27M and average daily trading volume is 10K shares.
As of June 2012 the annual dividend yield was 4.99% and YTD return -1.87%. The one year return was -12.62%. DBU trades commission free at E*Trade.
Data as of June 2012
DBU Top Ten Holdings and Weightings:
- Light S.A. (LIGT3): 2.70%
- Energy Company of Minas Gerais (CMIG3): 2.70%
- Drax Group PLC (DRX): 2.61%
- AES Tiete S.A. (GETI3): 2.48%
- Aguas Andinas S.A.: 2.19%
- Petronas Gas Bhd (6033): 1.86%
- RWE AG (RWE): 1.85%
- United Utilities Group PLC (UUGWF): 1.84%
- AGL Energy Limited (AGK): 1.83%
- Just Energy Group Inc (JE): 1.78%

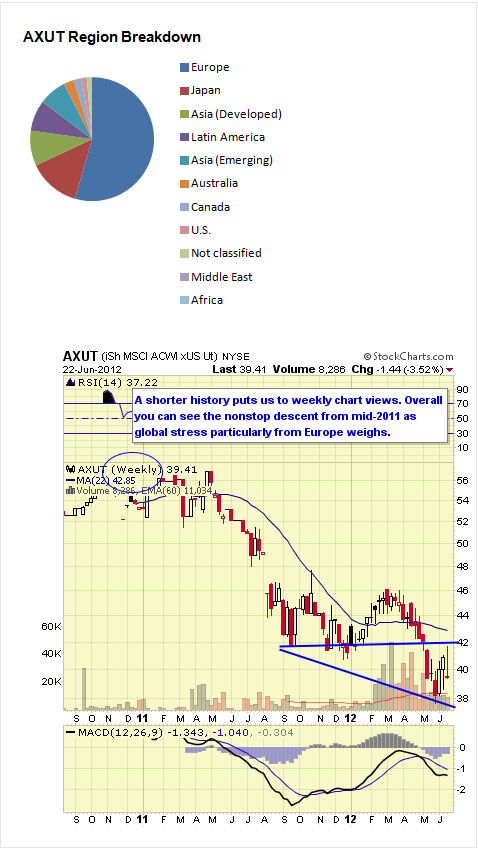
AXUT follows the MSCI All Country World ex-USA Utilities Index which is a market cap weighted index of developed and emerging market countries. The fund was launched in July 2010. The expense ratio is 0.48%. AUM equal $6M and average daily trading volume is 3K shares. As of June 2012 the annual dividend yield was 9.03% and YTD return -0.39%. The one year return was -15.02%.
With a fund this young but with a sponsor this big you would intuitively believe the fund has a better chance of succeeding versus with a smaller sponsor. Much of the poor growth is due to much unsettled economic issues globally.
Data as of June 2012
AXUT Top Ten Holdings and Weightings:
- National Grid PLC (NGGTF): 6.80%
- E.ON Aktiengesellschaft AG (ENAKF): 6.36%
- Centrica PLC (CPYYF): 4.82%
- GDF Suez (GSZ): 4.75%
- SSE Plc. (SSEZF): 3.73%
- ENEL Ente Nazionale per L'Energ Elet SPA (ESOCF): 3.61%
- RWE AG (RWE): 3.47%
- CLP Holdings Limited (CLPHF): 3.18%
- Iberdrola SA (IBE): 2.84%
- Hong Kong and China Gas Co., Ltd. (00003): 2.35%

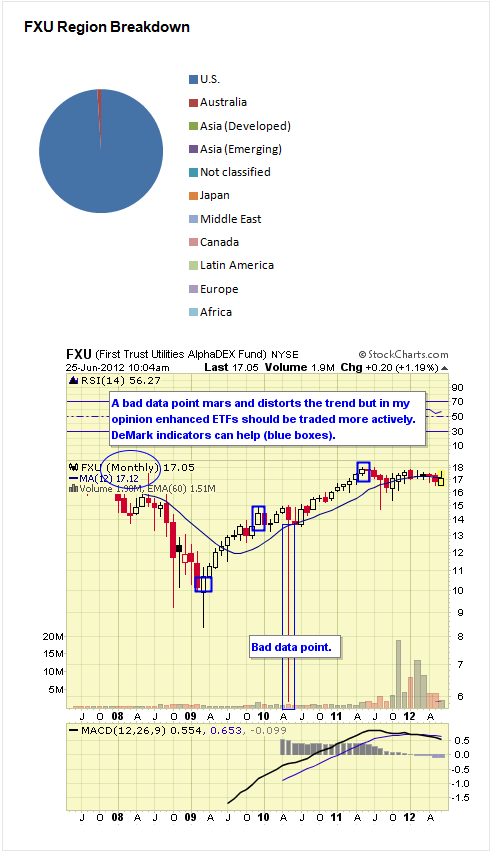
FXU follows the StrataQuant Utilities Index which is another “enhanced” index designed around quantitative methodologies by the NYSE Euronext employing the AlphaDEX system of constituent utilities selection from the Russell 1000 Index. The fund was launched in May 2007. The expense ratio is 0.70%. AUM equal $167M with average daily trading volume of 157K shares.
As of June 2012 the annual dividend yield was 1.85% and YTD return -0.39%. The one year return was 0.84%.
Data as of June 2012
FXU Top Ten Holdings and Weightings:
- NRG Energy Inc (NRG): 4.01%
- Sempra Energy (SRE): 3.99%
- Energen Corp (EGN): 3.94%
- Telephone and Data Systems, Inc. (TDS): 3.88%
- Public Service Enterprise Group Inc (PEG): 3.76%
- Entergy Corp (ETR): 3.60%
- United States Cellular Corporation (USM): 3.54%
- Level 3 Communications Inc (LVLT): 3.31%
- NII Holdings Inc (NIHD): 2.82%
- Atmos Energy Corp (ATO): 2.75%

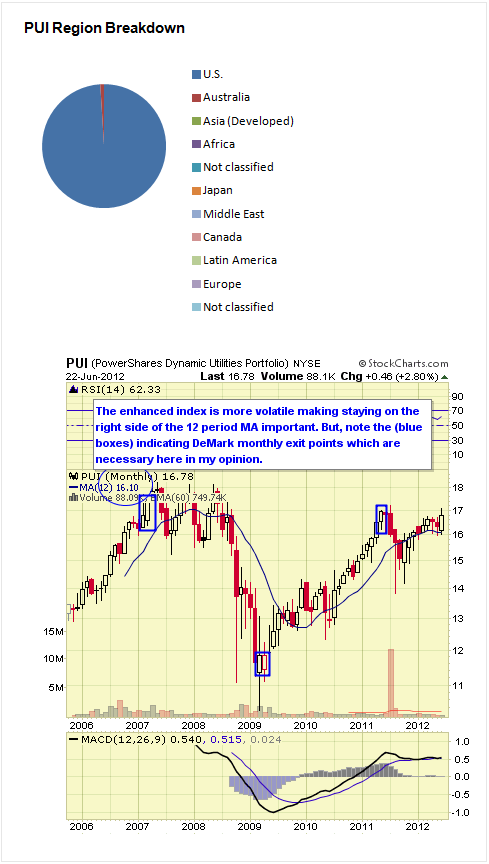
PUI follows the Dynamic Utilities Intellidex Index which is a so-called “enhanced” index since rather than a passive index approach the index is designed to select constituents using quantitative analytics intended to provide the greatest return. The fund was launched in October 2005. The expense ratio is 0.60%. AUM equal $41M and average daily trading volume is 9K shares.
As of June 2012 the annual dividend yield was 2.68% and YTD return 5.07%. The one year return was 2.90%.
Data as of June 2012
PUI Top Ten Holdings and Weightings:
- AT&T Inc (T): 2.72%
- Crown Castle International Corp (CCI): 2.70%
- FirstEnergy Corp (FE): 2.66%
- NextEra Energy Inc (NEE): 2.65%
- Verizon Communications Inc (VZ): 2.65%
- Motorola Solutions, Inc. (MSI): 2.59%
- Southern Co (SO): 2.58%
- American Electric Power Co Inc (AEP): 2.58%
- Public Service Enterprise Group Inc (PEG): 2.56%
- Xcel Energy Inc (XEL): 2.56%

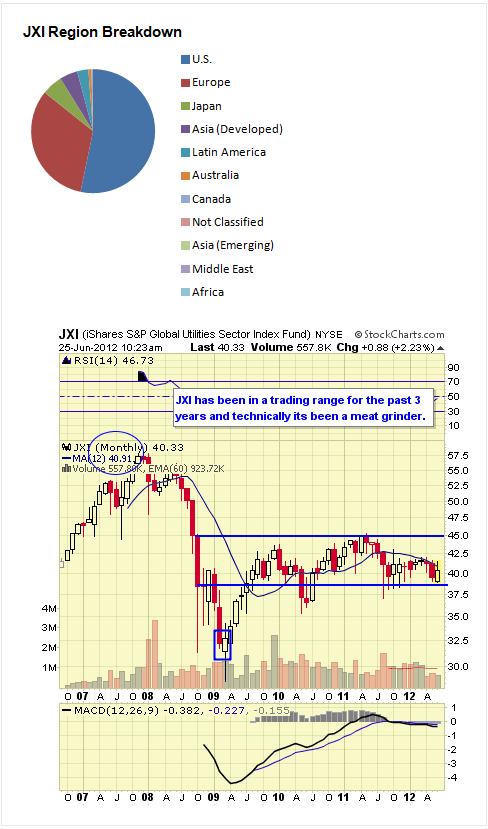
JXI follows the S&P Global Utilities Index which follows the performance of the global equity market. The fund was launched in September 2006. The expense ratio is 0.48%. AUM equal $270M and average daily trading volume is 34K shares.
As of June 2012 the annual dividend yield was 4.68% and YTD return 0.41%. The one year return was -4.05%.
Data as of June 2012
JXI Top Ten Holdings and Weightings:
- Southern Co (SO): 4.72%
- E.ON Aktiengesellschaft AG (ENAKF): 4.34%
- National Grid PLC (NGGTF): 4.22%
- Exelon Corp (EXC): 3.73%
- Dominion Resources Inc (D): 3.52%
- Duke Energy Corporation (DUK): 3.48%
- GDF Suez (GSZ): 3.38%
- NextEra Energy Inc (NEE): 3.22%
- Centrica PLC (CPYYF): 2.92%
- FirstEnergy Corp (FE): 2.32%

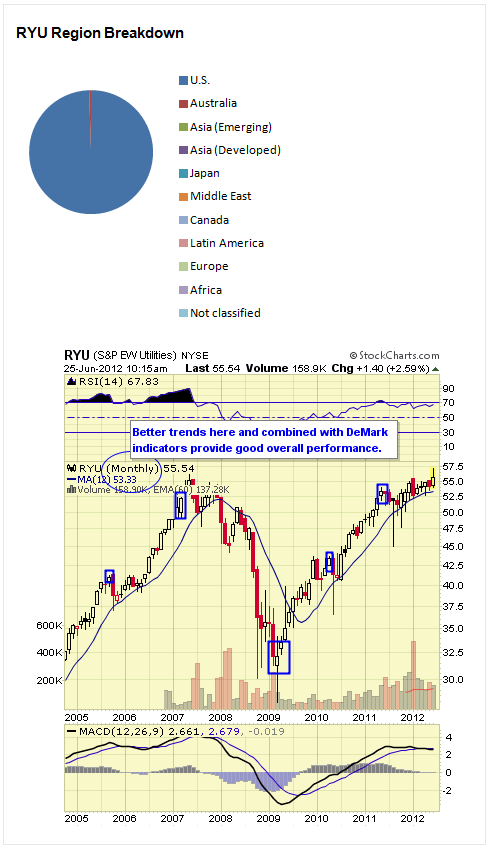
RYU follows the S&P Equal Weight Index which is not much different from XLU except that by breaking components into equal weights provides a different and perhaps fairer view of overall conditions. The fund was launched in January 2006. The expense ratio is 0.50%. AUM equal $48M and average daily trading volume is less than 8K shares. (NOTE: The sponsor has suffered numerous ownership changes and marketing efforts have been hindered. The structure of the index is sound but the liquidity and fees are still higher than average.) Remember the advantage of an equal weighted index-based ETF is an investor won’t be hurt by a bad situation in one but won’t be helped by a better performer either.
As of June 2012 the annual dividend yield was 3.36% and YTD return 3.55%. The one year return was 8.71%.
Data as of June 2012
RYU Top Ten Holdings and Weightings:
- Sempra Energy (SRE): 2.75%
- AT&T Inc (T): 2.74%
- NextEra Energy Inc (NEE): 2.73%
- Wisconsin Energy Corporation (WEC): 2.72%
- Verizon Communications Inc (VZ): 2.67%
- CMS Energy Corp (CMS): 2.66%
- CenterPoint Energy Inc (CNP): 2.63%
- Edison International (EIX): 2.63%
- Xcel Energy Inc (XEL): 2.63%
- SCANA Corp (SCG): 2.62%

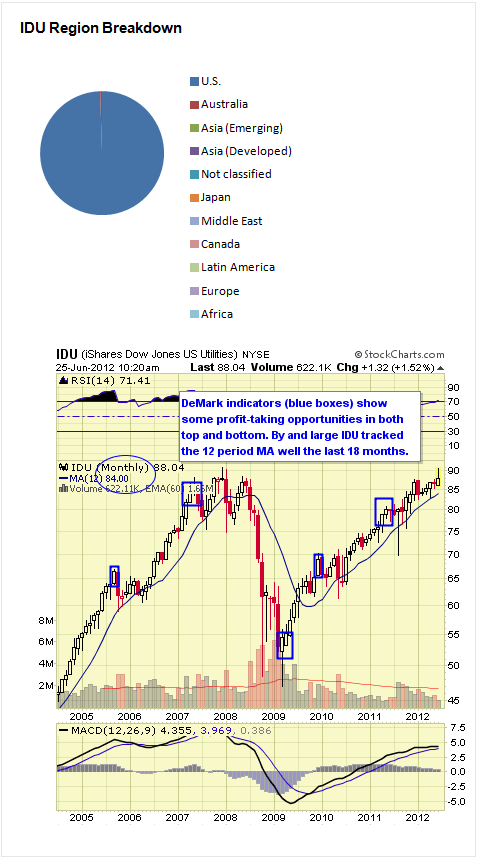
IDU follows the Dow Jones U.S. Utilities Index which also covers the broad spectrum of the utilities sector of the U.S. equity market. The fund was launched in June 2000. The expense ratio is 0.48%. AUM equal $717M and average daily trading volume is 42K shares.
As of June 2012 the annual dividend yield was 2.38% and YTD return 1.85%. The one year return was 11.88%.
Data as of June 2012
IDU Top Ten Holdings and Weightings:
- Southern Co (SO): 7.33%
- Exelon Corp (EXC): 5.82%
- Dominion Resources Inc (D): 5.51%
- Duke Energy Corporation (DUK): 5.39%
- NextEra Energy Inc (NEE): 4.96%
- FirstEnergy Corp (FE): 3.64%
- American Electric Power Co Inc (AEP): 3.45%
- Spectra Energy Corp (SE): 3.45%
- PG&E Corp (PCG): 3.36%
- Consolidated Edison, Inc. (ED): 3.27%

VPU follows the MSCI US Investable Market Utilities 25/50 Index which consists of small, medium and large companies. The fund was launched in January 2004. The expense ratio is 0.19%. AUM equal $1B and average daily trading volume is 72K shares.
As of June 2012 the annual dividend yield was 3.46% and YTD return 4.13%. The one year return was 14.56%. VPU trades commission free at Vanguard.
Data as of June 2012
VPU Top Ten Holdings and Weightings:
- Southern Co (SO): 7.33%
- Exelon Corp (EXC): 6.32%
- Dominion Resources Inc (D): 5.52%
- Duke Energy Corporation (DUK): 5.30%
- NextEra Energy Inc (NEE): 4.64%
- FirstEnergy Corp (FE): 3.61%
- American Electric Power Co Inc (AEP): 3.52%
- PG&E Corp (PCG): 3.33%
- Consolidated Edison, Inc. (ED): 3.24%
- PPL Corp (PPL): 3.09%

XLU follows the Utilities Select Sector Index covers most publicly traded U.S. utilities, multi-utilities, independent power producers & traders and gas utilities. The fund was launched in December 1998. The expense ratio is 0.18%. AUM equal $6B and average daily trading volume is 6M shares.
As of June 2012 the annual dividend yield was 2.87% and YTD return 2.81%. The one year return was 13.87%.
Inverse and leveraged issues are available from ProShares.
Data as of June 2012
XLU Top Ten Holdings and Weightings:
- Southern Co (SO): 9.02%
- Exelon Corp (EXC): 7.14%
- Dominion Resources Inc (D): 6.73%
- NextEra Energy Inc (NEE): 6.17%
- Duke Energy Corporation (DUK): 6.14%
- FirstEnergy Corp (FE): 4.44%
- American Electric Power Co Inc (AEP): 4.24%
- PG&E Corp (PCG): 4.11%
- Consolidated Edison, Inc. (ED): 4.04%
- Progress Energy, Inc. (PGN): 3.69%
We rank the top 10 ETF by our proprietary stars system as outlined below. However, given that we’re sorting these by both short and intermediate issues we have split the rankings as we move from one classification to another.![]()
Strong established linked index
Excellent consistent performance and index tracking
Low fee structure
Strong portfolio suitability
Excellent liquidity![]()
Established linked index even if “enhanced”
Good performance or more volatile if “enhanced” index
Average to higher fee structure
Good portfolio suitability or more active management if “enhanced” index
Decent liquidity![]()
Enhanced or seasoned index
Less consistent performance and more volatile
Fees higher than average
Portfolio suitability would need more active trading
Average to below average liquidity![]()
Index is new
Issue is new and needs seasoning
Fees are high
Portfolio suitability also needs seasoning
Liquidity below average
Disclaimer: It’s also important to remember that ETF sponsors have their own competitive business interests when issuing products which may not necessarily align with your investment needs. New ETFs from highly regarded and substantial new providers are also being issued. These may include Charles Schwab’s ETFs and Scottrade’s Focus Shares which both are issuing new ETFs with low expense ratios and commission free trading at their respective firms. These may also become popular as they become seasoned.