
Here are four stocks with buy rank and strong value characteristics for investors to consider today, January 27th:
American Equity Investment Life Holding Company (AEL): This company that provides life insurance products and services carries a Zacks Rank #1 (Strong Buy), and seen the Zacks Consensus Estimate for its current year earnings rising 39.1% over the last 90 days.
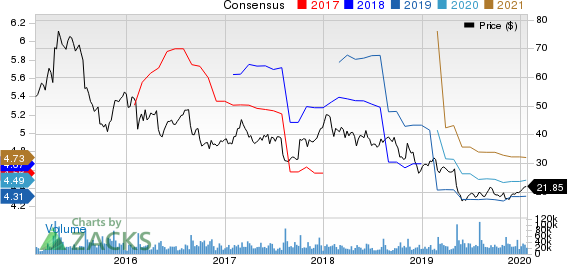
American Equity Investment Life Holding Company Price and Consensus
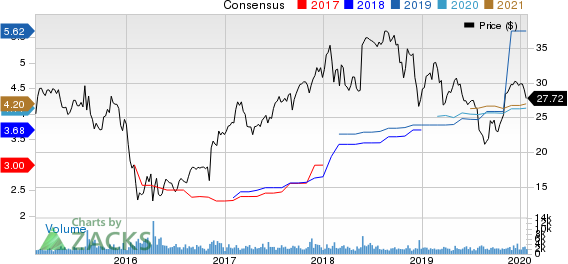
American Equity Investment Life Holding Company price-consensus-chart | American Equity Investment Life Holding Company Quote
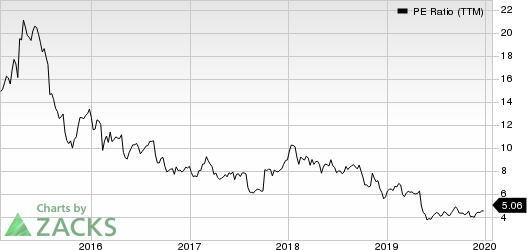
American Equity Investment Life Holding has a price-to-earnings ratio (P/E) of 6.74, compared with 13.10 for the industry. The company possesses a Value Score of A.
American Equity Investment Life Holding Company PE Ratio (TTM)
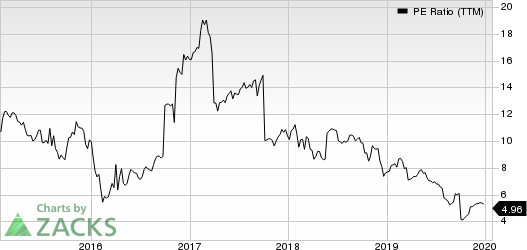
American Equity Investment Life Holding Company pe-ratio-ttm | American Equity Investment Life Holding Company Quote
CURO Group Holdings Corp. (CURO):This is a diversified consumer finance company, which provides consumer finance to a range of underbanked consumers has a Zacks Rank #1, and seen the Zacks Consensus Estimate for its current year earnings rising 1.8% over the last 90 days.
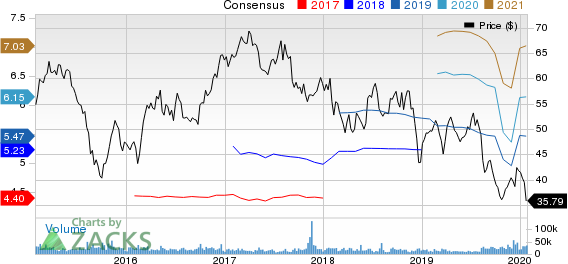
CURO Group Holdings Corp. Price and Consensus
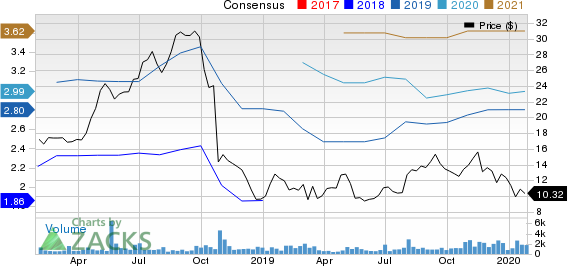
CURO Group Holdings Corp. price-consensus-chart | CURO Group Holdings Corp. Quote
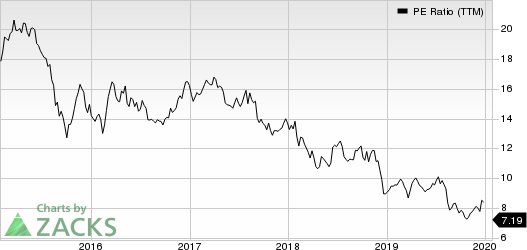
CURO Group Holdings has a price-to-earnings ratio (P/E) of 3.45, compared with 7.60 for the industry. The company possesses a Value Score of B.
CURO Group Holdings Corp. PE Ratio (TTM)
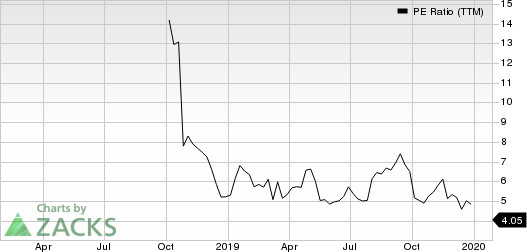
CURO Group Holdings Corp. pe-ratio-ttm | CURO Group Holdings Corp. Quote
Mylan (NASDAQ:MYL) N.V. (MYL): This company that develops, licenses, manufactures, markets, and distributes generic, branded-generic, brand-name, and over-the-counter pharmaceutical products has a Zacks Rank #1, and seen the Zacks Consensus Estimate for its current year earnings rising 1.2% over the last 90 days.
Mylan has a price-to-earnings ratio (P/E) 4.87, compared with 16.70 for the industry. The company possesses a Value Score of A.
ViacomCBS Inc. (VIAC): This is a media and entertainment, that creates content and experiences for audiences has a Zacks Rank #2 (Buy), and seen the Zacks Consensus Estimate for its current year earnings rising 5.8% over the last 90 days.
ViacomCBS has a price-to-earnings ratio (P/E) of 5.82, compared with 14.40 for the industry. The company possesses a Value Score of A.
See the full list of top ranked stocks here.
Learn more about the Value score and how it is calculated here.
Today's Best Stocks from Zacks
Would you like to see the updated picks from our best market-beating strategies? From 2017 through 2019, while the S&P 500 gained and impressive +53.6%, five of our strategies returned +65.8%, +97.1%, +118.0%, +175.7% and even +186.7%.
This outperformance has not just been a recent phenomenon. From 2000 – 2019, while the S&P averaged +6.0% per year, our top strategies averaged up to +54.7% per year.
See their latest picks free >>
CBS Corporation (NYSE:CBS_old) (VIAC): Free Stock Analysis Report
Mylan N.V. (MYL): Free Stock Analysis Report
CURO Group Holdings Corp. (CURO): Free Stock Analysis Report
American Equity Investment Life Holding Company (AEL): Free Stock Analysis Report
Original post
Zacks Investment Research