Technical Outlook:
- Extremely dull price action that only saw a trading range between 2048 and 2055 and when it finally started to move at the close yesterday, did nothing but close at the lower end of the range at 2048.
- Price action in the pre-market looks to take price to the upper end of the trading range from most of the past two days. However, it will not represent any technical improvements.
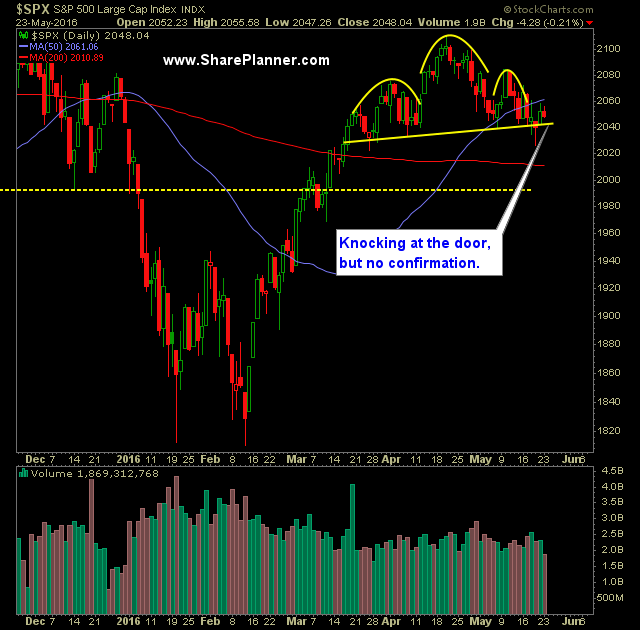
- Following a significant rally off of the February lows, SPX could be forming a massive bull flag. A break above 2065 would signify a push above and out of the bull flag and declining channel.
- So there are two scenarios to consider 1) Bull flag as I just mentioned, and 2) Head and shoulders pattern on the daily chart formed over the last two months.
- SPX still trading above the 5-day declining, moving average, but still below the 10, 20 and 50-day moving averages - all of which has converged together.
- Unable to establish a higher-high on the 30 minute chart of SPX, though today's pre-market strength suggests it will attempt to do so again.
- At the expense of sounding like a broken record, a break and close below of the 2039 price level will effectively confirm the head and shoulders pattern on the daily chart.
- VIX finished higher yesterday by 4.1% and still range bound. A push above 16.40 would change that. Though like yesterday, each time it tests the level, it immediately sells off.
- Volume on SPY (NYSE:SPY) yesterday fell off a cliff and came in well below average and the lowest volume reading of 2016 and just barely above the volume we saw on Christmas Eve (which was also a 1/2 day of trading and would have had more volume had it been open a full day).
- SPX is trading inside of a well defined channel on the daily off of the April highs. Currently the declining resistance is at 2065.
- The moving averages are all converging on current price action which is a sign of a market that hasn't moved any where in a couple of months.
- The last two times we saw this happen, a massive sell-off ensued (last August and December/January).
- From 2040 to 2138 - you have a price range that is insanely choppy and continues to be such.
- The 50-week and 100-week moving average have crossed two weeks ago to the downside. Last time this happened was 2001 before the tech correction and again in June 2008 before the mortgage crisis saw its major correction.
- I believe at this point, profits have to be taken aggressively, and avoid the tendency to let the profits run - the market is in a very choppy range that has mired stock price for the past two years. Unless it breaks out of it and onto new all-time highs, then taking profits aggressively is absolutely important.
- Historically the May through October time frame is much weaker than the rest of the year.
3rd party Ad. Not an offer or recommendation by Investing.com. See disclosure here or
remove ads
.
My Trades:
- Did not close any positions yesterday.
- Added one swing-trade to the portfolio yesterday.
- Currently 20% Short / 80% Cash
- Remain Short PowerShares QQQ Trust Series 1 (NASDAQ:QQQ)at $105.00 and one other position.
- The back and forth from the market over the last 7 trading sessions requires that we remain flexible in the current market environment.
Chart for SPX:
