Technical Outlook:
- S&P 500 faced a strong sell-off in the early going yesterday, but the dip buyers stepped in strong and rallied the market by recovering 75% of its losses on the day.
- Crude Oil showing strength in the pre-market - a break of last week's highs would create a short-term inverse head and shoulders confirmation.
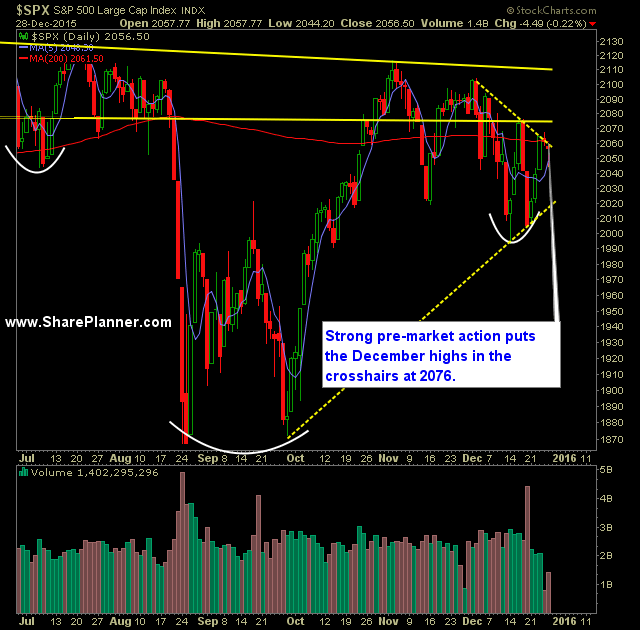
- Strong pre-market action puts 2076, the December highs, as a possible target for the day. In breaking 2076, the S&P 500 would establish its first set of higher-highs since early November and break the current short-term down-trend.
- Volume, for a full day of trading, was virtually non-existent, which is common for this time of the year, and much lower than the volume readings we had last week. I expect more of the same as the week progresses.
- CBOE Volatility Index lost about half of its gains from yesterday when following the market rally off of the lows of the day.
- S&P 500 30 minute chart, with pre-market strength should be able to from a higher-high.
- Key this week, with low volume trading, is whether it can continue on with the gains from last week. Historically, this week and last is the best two-week trading set of the year, and is where your infamous "Santa Rally" kicks off.
- On SPDR S&P 500 (N:SPY) the absolute key level for it rests at $200. A break below this level would send SPY firmly into bear territory.
- The rally from last week did little to alleviate oversold market conditions.
- There is a rising trend-line off of the September lows on S&P 500 that has been tested twice in the past three weeks and held up perfectly.
- A lot of talk about the "Golden Cross" taking place on S&P 500 with the 50-day moving average crossing above the 200-day moving average. I don't put much weight behind this phenomenon.
- For twelve years straight, the market over the course of the last 30 trading days of the calendar year, has yielded a net positive gain, and thus reinforcing the concept of the "Santa Rally". In order for that to happen again, S&P 500 would need to stay above 2050 and remain there through year-end.
3rd party Ad. Not an offer or recommendation by Investing.com. See disclosure here or
remove ads
.
My Trades:
- Added two new positions to the portfolio yesterday.
- Traded in and out of Netflix Inc (O:NFLX) position yesterday. Currently long in the stock.
- Not expecting this to be a heavy trading day for me (I said that yesterday, and I ended up adding one new position). Active trading for me to resume next week, to start the new year.
- Currently 70% Long / 30% Cash
- Remain long United Technologies Corporation (N:UTX) at $94.58, ProShares UltraPro S&P500 (N:UPRO) at $60.63, ProShares Ultra QQQ (N:QLD) at $76.77, Adobe Systems Incorporated (O:ADBE) at $92.42, and three additional positions.

