Technical Outlook:
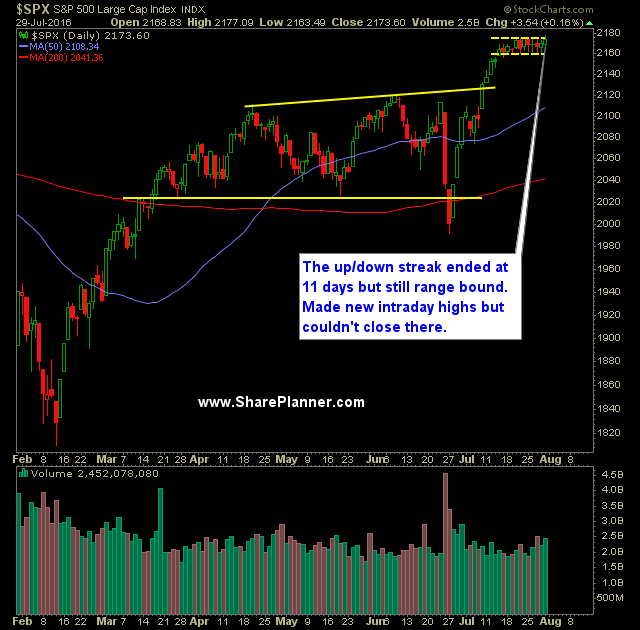
- S&P 500 (SPX) snapped its 11-day streak of up/down price behavior by finishing just a smidge higher on Friday.
- in doing so, it made a move above the 5-day moving average again.
- Despite making a new intraday high on Friday, the stock still closed inside of its recent trading range and has not provided new short-term direction for traders.
- I still maintain a long bias towards this market as that has been what the intermediate and long-term charts suggest still.
- With that said, August has been a rather weak month in recent months with sell-offs in four of the last six years.
- Overall, August is the worst performing month for the Dow and S&P 500.
- SPDR S&P 500 (NYSE:SPY) volume in the month of July dropped off in a major way and even 15% less than what was seen in 2015 and almost 40% less than what was seen in June.
- On Friday, volume on SPY daily was slightly higher then the day prior - but still well below recent averages.
- On the monthly chart, SPX broke out quite nicely out of its consolidation and made new highs. Technical analysis would suggest it is at the start of a bigger move, though that doesn't suggest it will be straight up from here.
- United States Oil Fund (NYSE:USO) showed some signs of a bounce, but it is hard to put any merit in it here until we can see it sustain that bounce. Still if oil cannot bounce at some point it will take its toll on the broader market as has been seen in the past.
- Volatility Index (VIX) chart on Friday saw a heavy sell-off of 6.7% down to 11.87. This rejection and move below 12 is significant and suggests further downside in the days ahead.
- For now, the consolidation looks like a bull flag that the market is trying to pull out of. Don't marry yourself to it, but the potential is real.
- 30-minute chart of SPX still looks extremely choppy. Upside here today should leave it behind.
- This week will be another heavy week of earnings. After this week, most of the major players will be out of the way.
- Dow Jones Industrial Average (DJIA) sold off for a fifth straight day. Despite the other indices looking to push higher, DJIA has now shown any signs of such and is diverging from the market.
- The trading range over the last 12 trading sessions has been less than 1% - one of the tightest ranges ever to occur during such a stretch.
- SPX trading range continues to come in incredibly choppy. Two price levels to watch that will signify further weakness in the market is 2059 and 2055.
- At this point, and with the election ahead, I'd expect the market to keep rallying higher. I don't expect there to be a rate hike between now and the election. To do so would impact the market and thereby the election. I don't think the Fed wants that, particularly since Trump has indicated that he would replace Yellen.
3rd party Ad. Not an offer or recommendation by Investing.com. See disclosure here or
remove ads
.
My Trades:
- Sold iShares Nasdaq Biotechnology (NASDAQ:IBB) on Friday at $289.63 from $274.95 for a 5.4% profit.
- I added one additional long position on Friday.
- I did add one new swing-trade to the portfolio yesterday.
- May add 1-2 new swing-trades to the portfolio today.
- Will consider hedging the portfolio as well with a short position.
- Currently 40% long / 60% cash
Chart for SPX:

