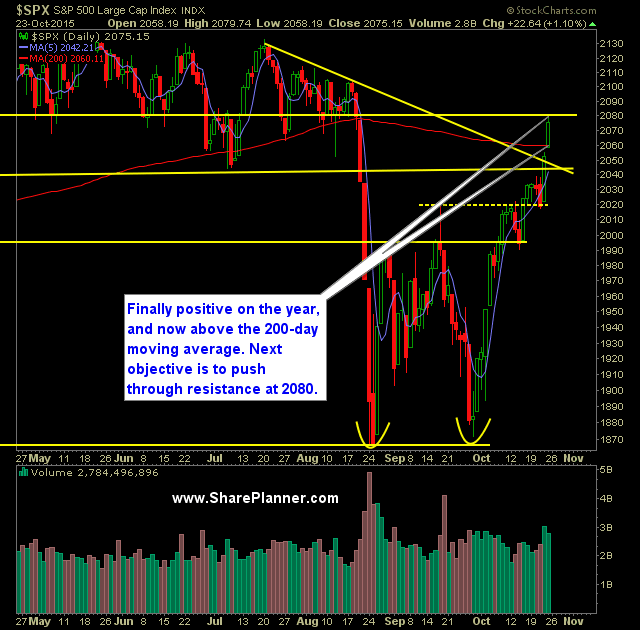
Technical Outlook:
- Huge rally again for a second day in a row, sending SPX up 56 points over that two-day stretch.
- Friday's rally saw SPX get back into positive territory for the year.
- The 200-day moving average of SPX has now been broken.
- The rally was far from anything being broad-based. In fact, the advancers vs. decliners only held a 1.3 to 1 advantage. Typically in a big rally, you see numbers of 3 or 4 to 1.
- Rally was primarily due in part to earnings beats by Amazon (O:AMZN), Google (O:GOOGL), and Microsoft (O:MSFT).
- Despite the rally of the past two days and the week prior, the T2108 (% of stocks trading above the 40-day moving average) has completely flat-lined. I am watching for a downside break at this point below 55% (currently at 65%). The flat-lining indicator is a major divergence against this market rally.
- To add to the mixed signals of Friday's rally, VIX rallied off of 13.24 to finish at 14.35 and to finish a smidge higher on the day.
- The current rally is impressive, but with some of the observations mentioned above, there is reason to become more concerned with its ability to maintain the current pace.
- 30-minute chart suggests some consolidation or even a pullback of some type.
- Volume dropped off on SPDR S&P 500 (N:SPY) and was slightly below average on Friday.
- Downtrend off of the July highs was broken last week too.
- Ultimately, price on SPX is entering a range that has notoriously been difficult trading for most and one that vacillates consistently within a narrow range.
- 10-day moving average continues to be a strong barometer of market direction - a close below it would represent a significant market reversal.
- Essentially there are three resistance levels to watch: 1) Lower channel, range resistance at 2040 as shown below, 2) Declining resistance off of the July highs, which currently sits at 2039, and 3) 200-day moving average which also coincides with SPX's break even level at 2059.
- The Fed has never raised interest rates at a point where the market was trading lower on the year. Currently, SPX is trading in positive territory heading into Wednesday's announcement.
My Trades:
- Sold O:FB on Friday at $102.23 for a 7.5% gain.
- Sold N:TYC on Friday at $36.91 for a 1.5% gain.
- Sold N:CVX on Friday at $90.57 for a 0.9% gain.
- Did not add any new swing-trades on Friday.
- 30% Long / 70% Cash
- Remain long: N:DIS at $105.88, N:MFC at $16.81, N:MSI at $70.66
- Will look to add 1-2 new long positions today on continued market strength.
Chart for SPX:

