Get 40% Off
These stocks are up over 10% post earnings. Did you spot the buying opportunity? Our AI did.Read how

Today's Trading Plan: Another Day, Another Huge Gap

Published 09/03/2015, 01:08 AM
Updated 07/09/2023, 06:31 AM

Technical Outlook:

  • Markets are looking to bounce hard - this time up. The day-to-day consistencies of this market is making it a near impossibility for traders holding for extended periods.
  • A sell-off of 469 points yesterday, sees a 230 point gap up today, and really on no news of any real meaning.
  • This is why you have to stay nimble in this market. The bounces are insane, 90% of the move happens overnight, and you simply can't predict, with any real certainty, the direction that it is going to take.
  • NYSE:SPY volume yesterday saw a noticeable increase, well above average readings.
  • S&P futures, is sporting a well-defined inverse head and shoulders pattern that must be respected going into today.
  • Ultimately, I think that SPX, at the very least is going to test last week's lows, however depending on today's rally and whether it holds, could play a large role in determining whether this comes to fruition or not.
  • Chinese markets are on a holiday for the remainder of the week.
  • VIX rallied yesterday only 10.5% but back above 30, to 31.40.
  • Massive drop in T2108 yesterday (stocks trading above their 40-day moving average) losing 38% all the way down to 11.9%.
  • Trade nimble, be careful about holding positions overnight, because the volatility is still at extreme levels and much of the daily moves are happening before the market ever opens.


My Trades:

  • Added one new short position yesterday.
  • Did not close out any positions yesterday.
  • 20% Short / 80% Cash
  • I am using a ultrashort ETF for my position.
  • Long SDS from $22.26 (2x Ultra Short position).
  • Current rally has run out of steam and now I will look for opportunities to add 1-2 new short positions to the portfolio.
3rd party Ad. Not an offer or recommendation by Investing.com. See disclosure here or remove ads .

Chart for SPX:
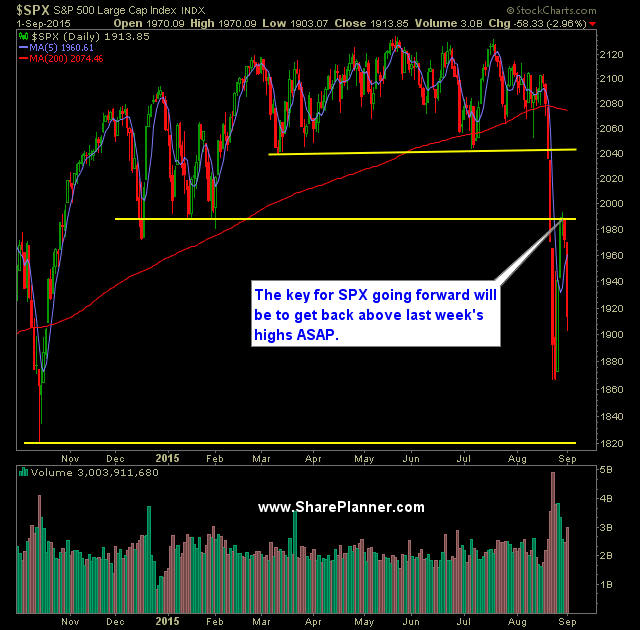
SPX Daily Chart

Original post

Latest comments

Risk Disclosure: Trading in financial instruments and/or cryptocurrencies involves high risks including the risk of losing some, or all, of your investment amount, and may not be suitable for all investors. Prices of cryptocurrencies are extremely volatile and may be affected by external factors such as financial, regulatory or political events. Trading on margin increases the financial risks.
Before deciding to trade in financial instrument or cryptocurrencies you should be fully informed of the risks and costs associated with trading the financial markets, carefully consider your investment objectives, level of experience, and risk appetite, and seek professional advice where needed.
Fusion Media would like to remind you that the data contained in this website is not necessarily real-time nor accurate. The data and prices on the website are not necessarily provided by any market or exchange, but may be provided by market makers, and so prices may not be accurate and may differ from the actual price at any given market, meaning prices are indicative and not appropriate for trading purposes. Fusion Media and any provider of the data contained in this website will not accept liability for any loss or damage as a result of your trading, or your reliance on the information contained within this website.
It is prohibited to use, store, reproduce, display, modify, transmit or distribute the data contained in this website without the explicit prior written permission of Fusion Media and/or the data provider. All intellectual property rights are reserved by the providers and/or the exchange providing the data contained in this website.
Fusion Media may be compensated by the advertisers that appear on the website, based on your interaction with the advertisements or advertisers.
© 2007-2024 - Fusion Media Limited. All Rights Reserved.