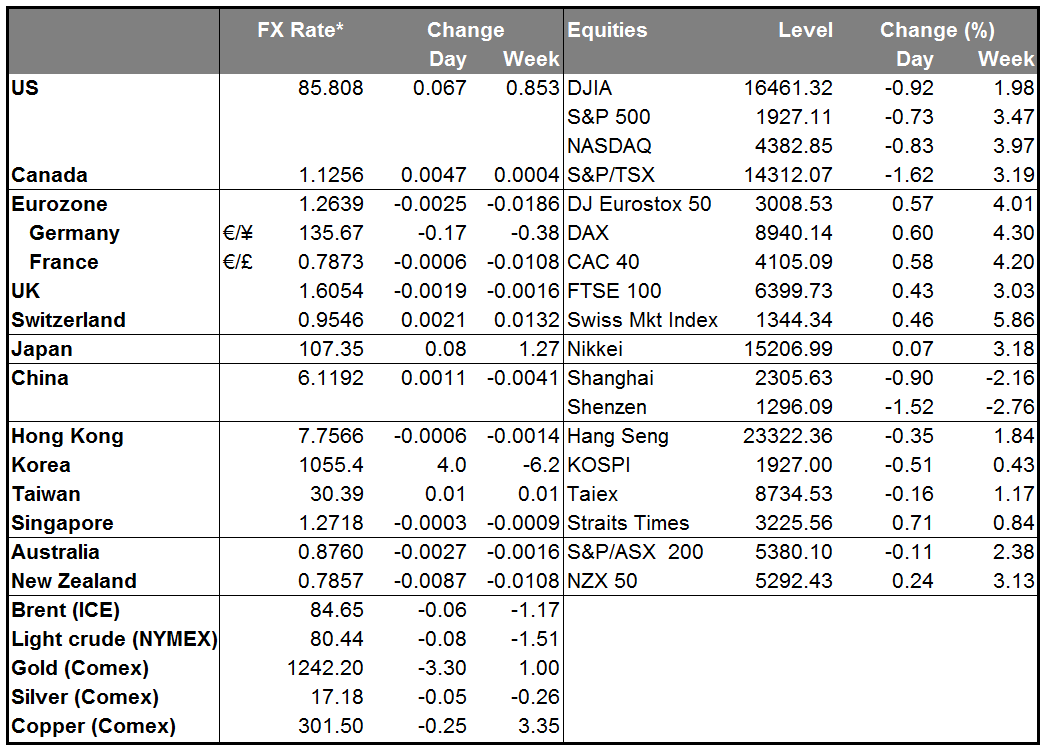
Nowotny lets the cat out of the bag ECB Governing Council member Ewald Nowotny made a striking admission yesterday: he noted that although there’s no decision yet on buying corporate bonds, “the main concern of the ECB is that we have a shrinking balance sheet. And so of course the point is how to achieve growth of the balance sheet, which I personally think is a legitimate point. Corporate bonds are one of the markets that are still open for this.” The statement shows how the ECB’s aims have changed. Until now it’s cloaked its operations as a way of easing credit and ensuring that monetary policy is transmitted effectively throughout the Eurozone, but Nowotny now says the ultimate aim is simply balance sheet expansion. That’s the definition of quantitative easing. The question of whether buying corporate bonds is a fair and effective way to get credit to the private sector is therefore secondary.
With the ECB launched on QE and the Fed set to end its QE next week, the dollar rose against all its G10 counterparts overnight. Indeed it also rose against almost all the EM currencies we track, too (except for ZAR).
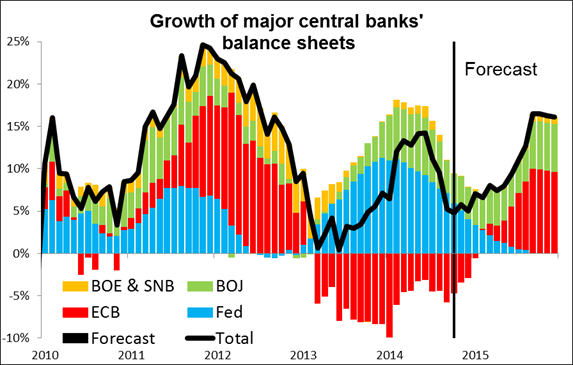
Will the ECB be able to pick up the slack from the Fed and support the global economy? I think it would. I did a small experiment. I made the following assumptions: 1) The ECB grows its balance sheet back to the previous peak level by end-2015. 2) The Fed’s balance sheet stays unchanged. 3) The Bank of Japan and Bank of England continue to grow their balance sheets at their current rate (the average for 2014), while 5) the Swiss National Bank grows its balance sheet at double the recent pace because of intervention as EUR weakens. The result, as shown in the graph, is that total central bank assets would continue to rise and at an accelerating pace during 2015. This should keep global economies – or at least global financial markets – afloat. It also means the Eurozone and Japan would be the major source of new liquidity, which implies that EUR and JPY will be the main funding currencies. It looks to me like they are set to weaken further.
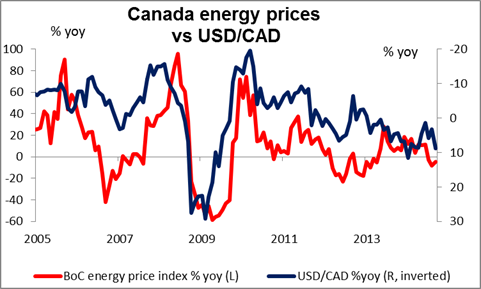
Oil had a miserable day after the US Energy Information Administration (EIA) that crude oil inventories rose 7.1mn barrels in the latest reporting week, more than double the 3mn that was expected. Libya’s OPEC Governor called for a 500k b/d reduction in OPEC’s 30.9mn b/d output in order to bring supply more into line with demand. But with Saudi Arabia no longer willing to play the role of swing producer and oil prices now well below the fiscal break-even line for most OPEC countries, I see little chance of OPEC imposing and maintaining any such cuts. In any event, OPEC has estimated that output would have to be cut by 2mn b/d in order to halt the decline in prices. I expect oil prices to continue to fall, dragging the commodity currencies – particularly CAD – down with them. Energy accounts for 23% of Canada’s exports.
New Zealand’s Q3 inflation rate slowed to 1.0% yoy, a sharp deceleration from +1.6% yoy in Q2 and below market expectations of 1.2% yoy. NZD/USD instantly dropped about 50 pips and continued to ease. Despite the inflation rate being within the RBNZ’s range target of 1%-3% over the medium term, the decline to the lower boundary of the range suggests less pressure for the RBNZ to resume raising rates.
Today’s indicators: Today is PMI day. The round started off well in China, where the HSBC China manufacturing PMI rose to 50.4 from 50.2. The market had expected it to be unchanged. AUD/USD had a brief 15-pip spike in the news, but it quickly came back down, indicating that the FX market doesn’t think this signals a turnaround for the Chinese economy. The news was not convincing to other markets either, as Chinese stocks fell and the yuan was little changed. Japan’s manufacturing PMI also rose further into positive territory, but I have never in my life heard anyone refer to the Japanese PMI and indeed there was no response in the currency until 10 minutes after the release, at which point USD/JPY rose (presumably along with a spike up in the Tokyo stock market that occurred at the same time).
During the European day, Eurozone’s preliminary PMIs, also for October, are released just after the figures from Germany and France are announced. The bloc’s manufacturing PMI is projected to fall below its 50 line for the first time since June 2013, while the manufacturing PMI from its growth engine, Germany, is anticipated to remain in its contractionary territory and decline further. If the PMIs releases come weak, it would likely keep the EUR under selling pressure.
In Norway, the spotlight will be on the Norges Bank policy rate decision. At their last meeting, the Bank removed a sentence included in June statement about needing to cut rates. However, a batch of recent weak data and the announcement of the central bank that it will start selling foreign exchange currency to cover increasing budget needs make me think the Bank is likely to maintain an easier stance, particularly given the recent plunge in oil prices.
In the UK, retail sales excluding gasoline for September are expected to decelerate, adding to the recent batch of poor data coming from the country and perhaps putting more downward pressure on GBP.
In Sweden, the unemployment rate for September is to be released. Added to the current deflationary status of Sweden, the forecast of rise in unemployment rate could prove SEK-negative.
US weekly jobless claims are set to rise in the latest week, but remain well below 300k. The Markit US manufacturing PMI is forecast to decline slightly, but still should remain among the highest in the industrial world. Meanwhile the leading index for September is forecast to rise. USD may be in for another good day today.
The Market
EUR/USD continues falling
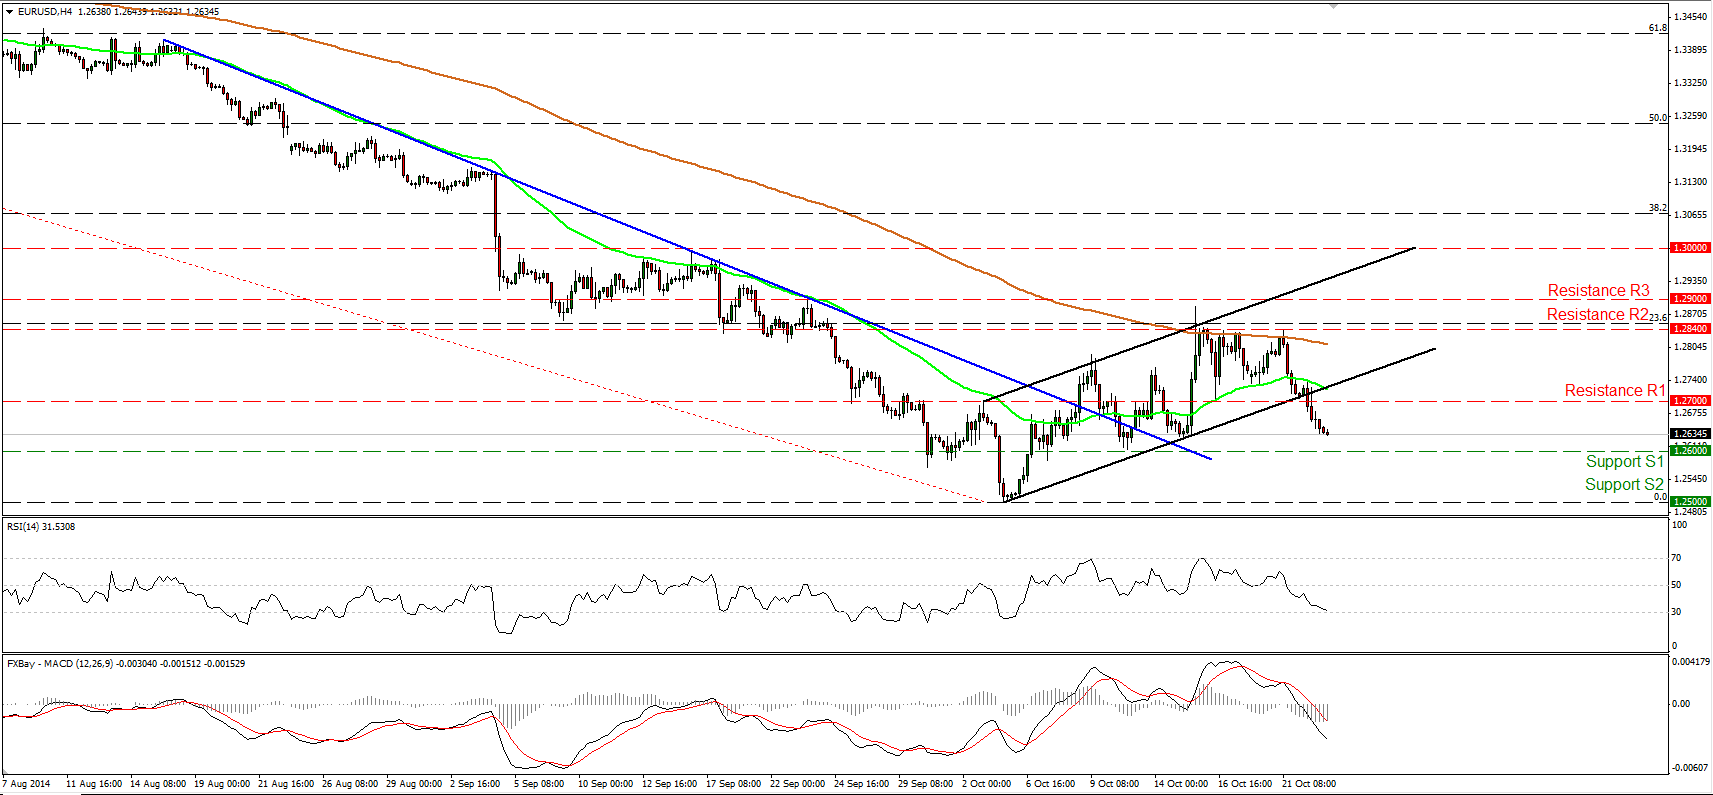
EUR/USD continued falling on Wednesday as a news agency reported that at least 11 banks from six European countries are set the fail the stress tests conducted by the ECB, and after the US CPI rate remained steady in September instead of declining as the market anticipated. The pair dipped below the 1.2700 support (turned into resistance) and below the lower boundary of the black near-term upside channel. The move below 1.2700 is a first sign that the recovery from 1.2500 (S2) has probably ended near the 200-period moving average and the 23.6% retracement level of the 8th of May - 3rd of October downtrend. Eurozone's PMIs are coming out today and the forecasts point to a decline in both the manufacturing and service sectors. This could push the rate to test the 1.2600 (S1) line. A clear break below that hurdle is likely to open the way for the psychological barrier of 1.2500 (S2), which happens to be the 76.4% retracement level of the July 2012- May 2014 major advance.
• Support: 1.2600 (S1), 1.2500 (S2), 1.2465 (S3).
• Resistance: 1.2700 (R1), 1.2840 (R2), 1.2900 (R3).
GBP/JPY rebounds from 171.00
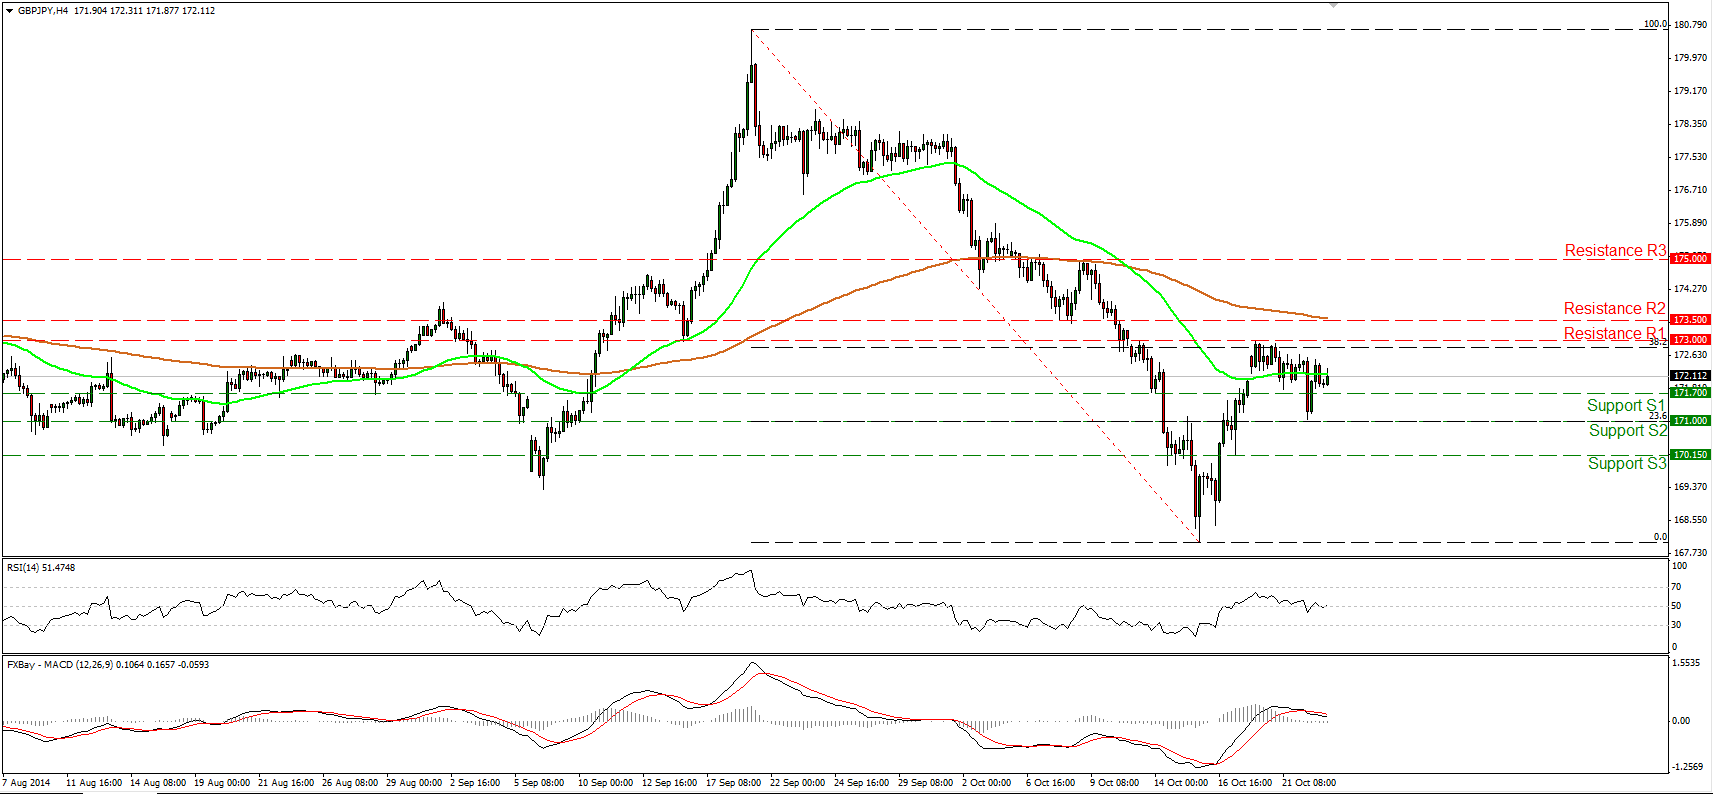
GBP/JPY rebounded from the 171.00 barrier and is currently trading between the 171.70 (S1) line and the resistance of 173.00 (R1), which lies fractionally above the 38.2% retracement level of the 19th September - 15th October decline. In the daily chart, the 14-day RSI moved lower after finding resistance near its 50 line, but the MACD shows signs of bottoming and could move above its trigger line in the near future. Taking these conflicting momentum signs into account, I would prefer to wait for a clearer technical picture. On the downside, a move below 171.00 (S2) is likely to trigger extensions towards the next support at 170.15 (S3). On the other hand, I need to see a move above 173.50 (R2) to shift my attention to the upside.
• Support: 171.70 (R1), 171.00 (R2), 170.15 (S3).
• Resistance: 173.00 (R1), 173.50 (S2), 175.00 (S3).
NZD/USD tumbles on New Zealand's CPI data
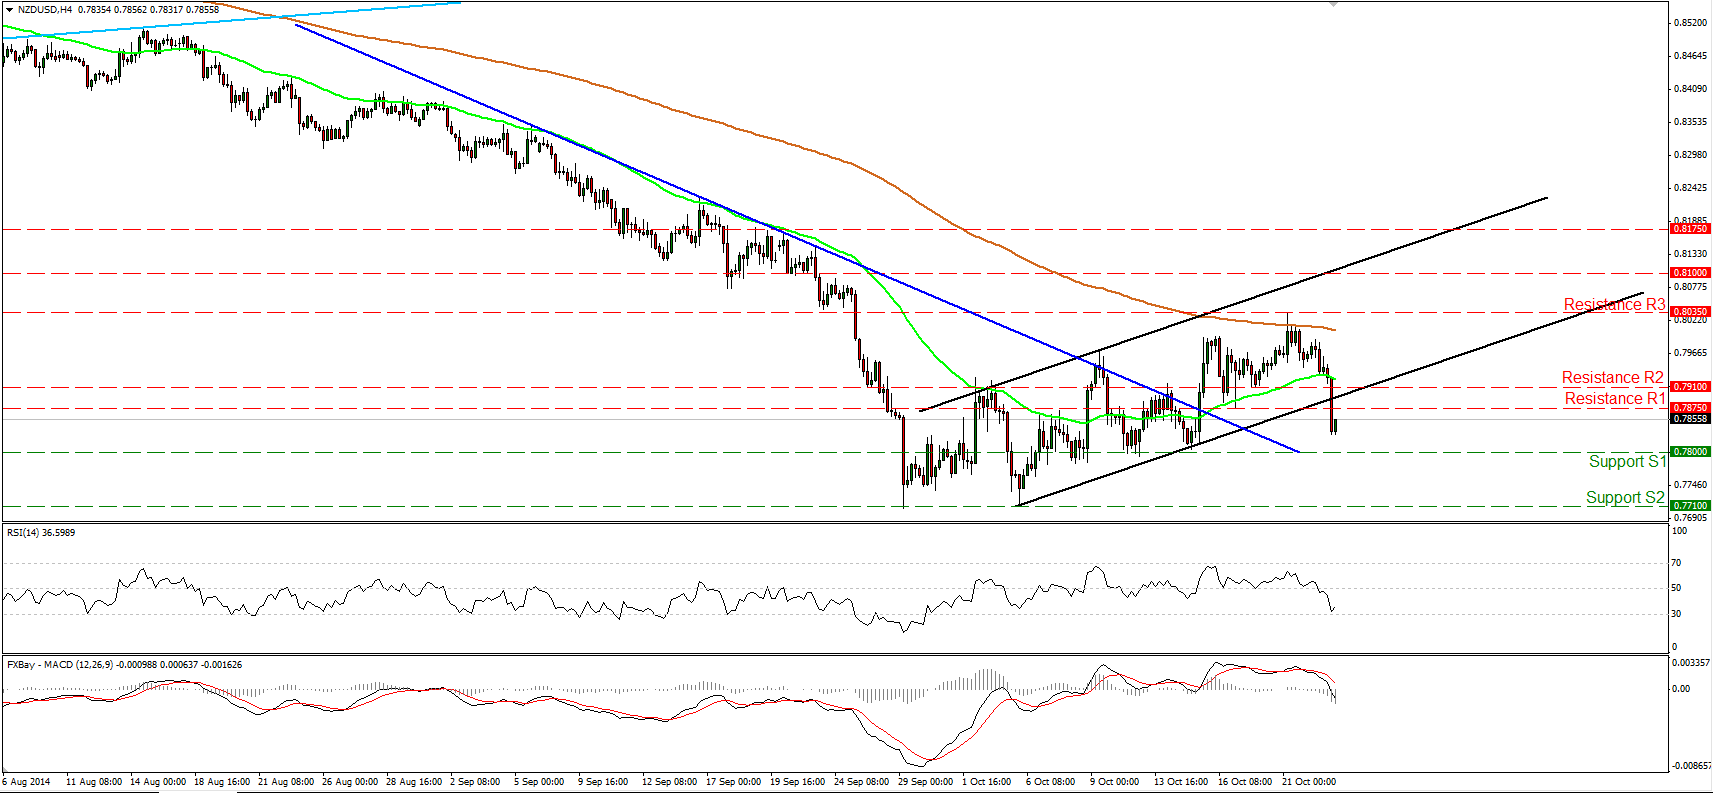
NZD/USD plunged after New Zealand's CPI slowed by more than expected in Q3. The rate violated two support lines (turned into resistance) in a row and the lower bound of the upside short-term black channel. This could be a sign that the 29th September - 21st October up move was just an upside correction and is now over. On the daily chart, Tuesday's candle looks like a shooting star pattern. The 14-day RSI hit its 50 bar and turned down, while the MACD, already negative, could move below its signal in the close future. These technical signs support the aforementioned view and buttress the case for the longer-term downtrend to continue. A clear move below the key support of 0.7800 (S1) will add to that and could pave the way for the low of the 6th of October at 0.7710 (S2).
• Support: 0.7800 (S1), 0.7710 (S2), 0.7680 (S3).
• Resistance: 0.7875 (R1), 0.7910 (R2), 0.8035 (R3).
Gold pulls back after hitting 1255
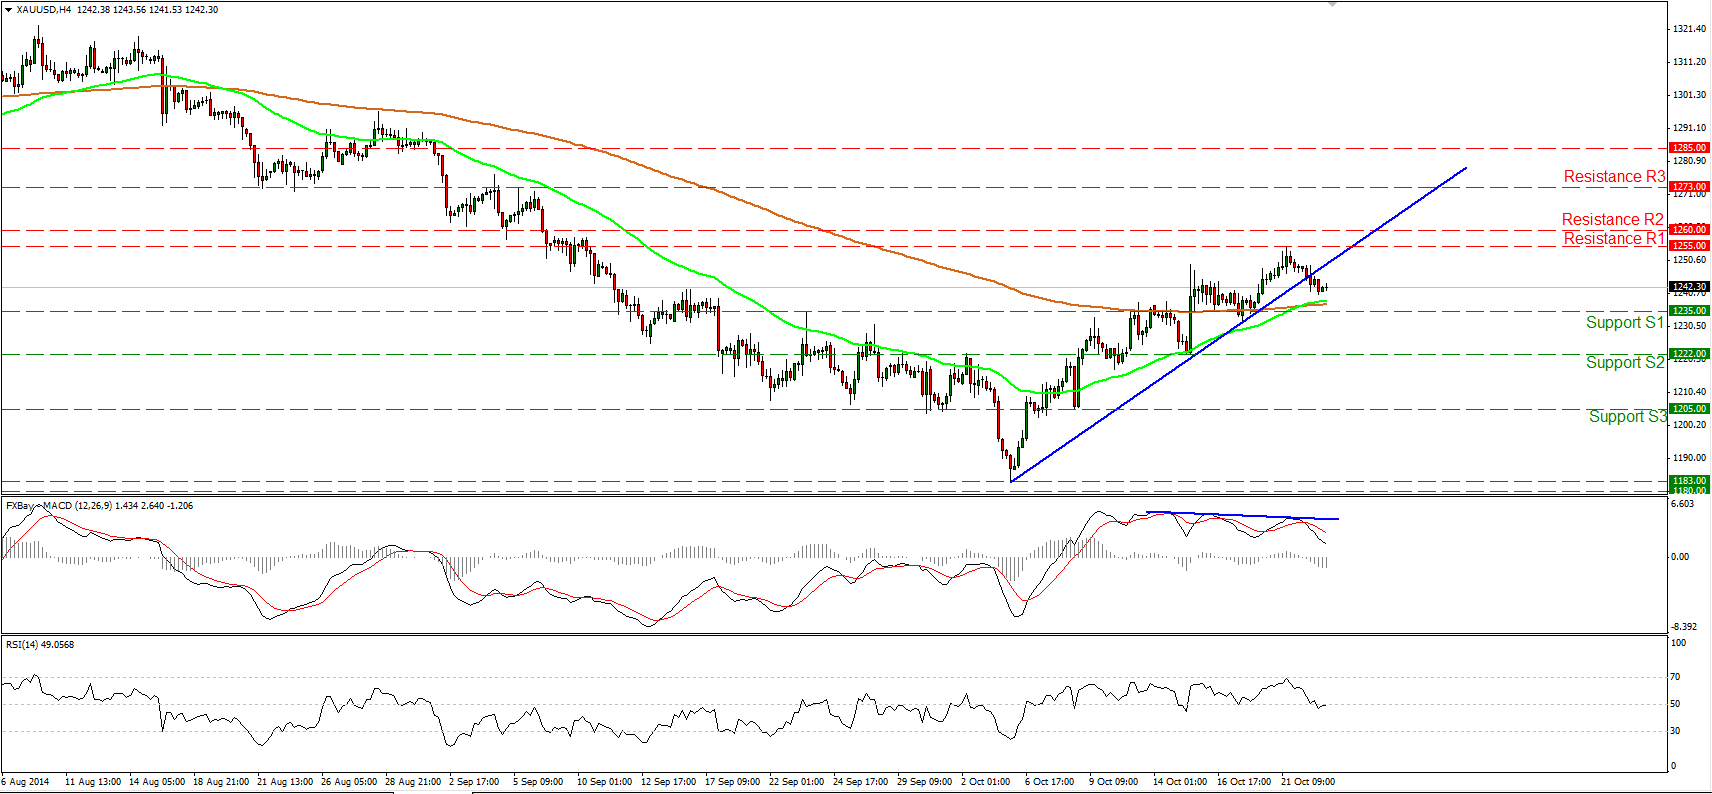
Gold moved lower yesterday, breaking below the blue short-term uptrend line and confirming the negative divergence between the MACD and the price action. Moreover, the MACD fell below its signal line, while the RSI moved lower and appears willing to fall below 50. However, I would like to maintain my flat approach as the possibility for a higher low still exists and since the 50- period moving average lies above the 200-period one. A dip below the 1235 (S1) zone is the move that would signal a forthcoming lower low on the 4-hour chart and perhaps turn the short-term outlook negative. Such a break could target our next obstacle of 1222 (S2).
• Support: 1235 (S1), 1222 (S2), 1205 (S3).
• Resistance: 1255 (R1), 1260 (R2), 1273 (R3).
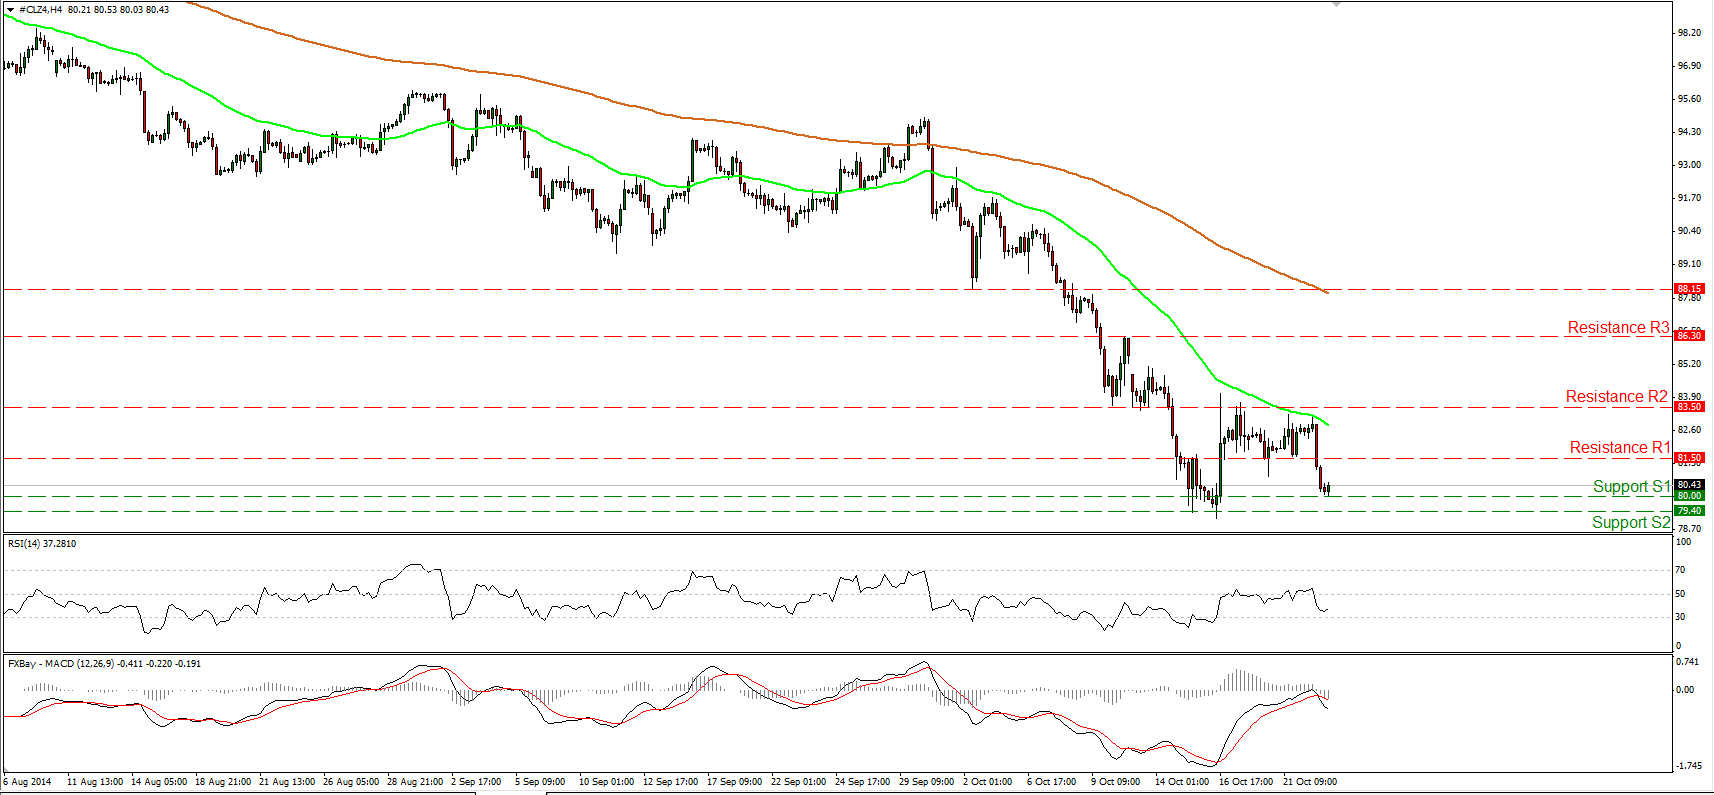
WTI collapses after the EIA report
WTI collapsed on Wednesday after the US Energy Information Administration reported inventories rose more than the market was expecting. The sharp fall was halted by the psychological barrier of 80.00 (S1). As long as the price structure on the daily chart remains lower peaks and lower troughs below both the 50- and the 200-day moving averages, I still see a downtrend. However, as mentioned before I would like to see a decisive dip below 79.40 (S2) before getting confident on the downside. Back on the 4-hour chart, the RSI dipped back below its 50 line, while the MACD returned within its negative field and crossed below its trigger, confirming yesterday' s negative momentum.
• Support: 80.00 (S1), 79.40 (S2), 79.00 (S3).
• Resistance: 81.50 (R1), 83.50 (R2), 86.30 (R3).

