US Dollar trades near range lows versus the Japanese Yen
A look at real FX volume indicator highlights key levels worth watching
We’re waiting for a drop towards bigger support
The Dollar is trading in a tiny range versus the Japanese Yen. Is it a good time to buy? These are the price levels we’re watching for potential trades.
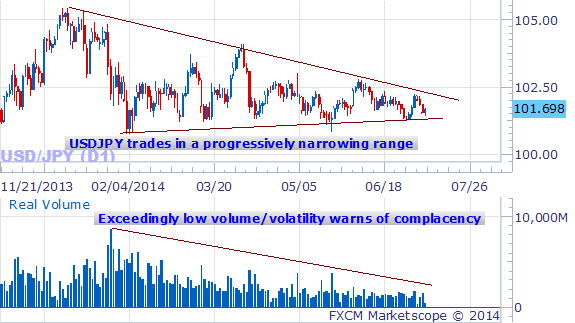
USD/JPY Coiling up For Next Big Move as Low Volume and Volatility Warn of Complacency

Source: FXCM Trading Station Desktop, FXCM Real Volume and Transactions Indicator, Prepared by David Rodriguez.
The USD/JPY currently trades towards the bottom of its tiny trading range. In order to gauge whether a breakdown is possible we take a look at the most significant levels of trader interest—prices at which volume was highest.
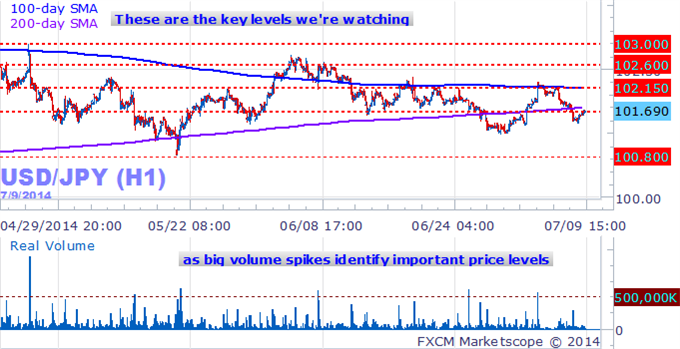
Spikes in Volume Tell us Where Traders are Most Likely to Defend Support and Resistance

Source: FXCM Trading Station Desktop, FXCM Real Volume and Transactions Indicator, Prepared by David Rodriguez.
Our data shows that the biggest volume spikes in the past three months occurred when the USDJPY traded to ¥100.80, 101.70, 102.15, 102.60, and 103.00. Why does this matter?
Put simply, these are the levels which traders have traded most aggressively as the pair sticks to its narrow range. If there was significant selling interest as the pair pulled back from ¥102.15, for example, we might expect many of the same traders to sell once more if price approaches that level.
It bears mention that there was no such spike in volume as the USD/JPY traded into multi-month lows near ¥101.20. We have to go back to the May low at ¥100.80 to see a more significant jump in trading volume. All the while, there are a number of important resistance levels just above current price.
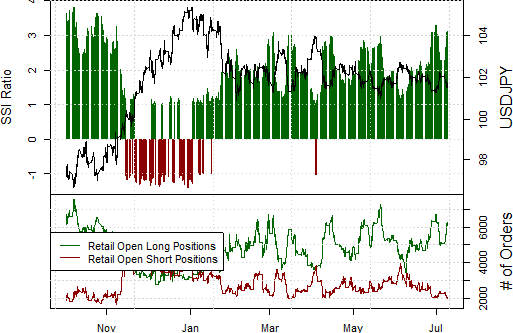
A closer look at what traders are holding shows that the vast majority remain long the USD/JPY. In fact our Retail FX Positioning chart (below) shows that current levels of positioning have coincided with Dollar bounces on a year-to-date basis. Does that mean we might buy the USD/JPY at current levels?
Retail FX Positions Consistent with Important Turns in USD/JPY

Source: FXCM Retail FX Positioning Data, Prepared by David Rodriguez.
One-sided positions suggest the pair is likely to trade higher, but potential reward on the trade looks limited in comparison to potential risk. According to our volume data, big support is at ¥100.80—currently 90 points from market price at 101.70. Important resistance starts at ¥102.15 which would put our first price target on a long position a mere 45 points away.
With twice as much risk as potential reward (90 versus 45), it seems excessively risky to buy USD/JPY at current levels. Instead we might look to buy if price dips back towards the 100.80 lows with a target for range highs.
The long-term consolidation pattern suggests that the USD/JPY might break significant price levels and could be worth a buy. Yet until that happens we’ll look for range trading opportunities.
--- Written by David Rodriguez, Quantitative Strategist for DailyFX.com David specializes in automated trading strategies.
