Last week, I wrote that traders looking for a correction should closely monitor the behavior of cyclical stocks (see Correction? Watch the cyclicals!). So far, cyclical stocks remain in a relative uptrend when compared to the market and their relative uptrend remains intact. There is no hint that a correction has begun.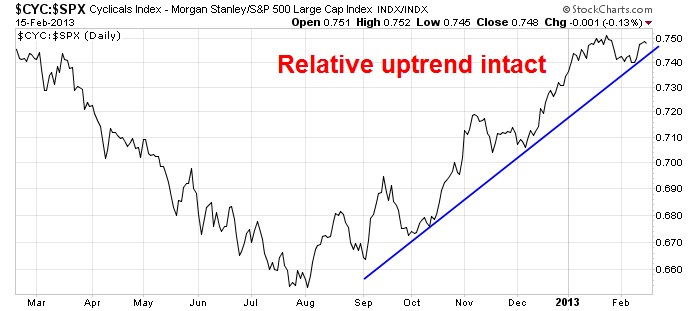
What I do find unusual is that while the relative performance of cyclical stocks remain robust, the shares of commodity producers continue to lag. This is curious when resource stocks represent the most cyclically sensitive sectors of the stock market.
In addition, the price of gold is deflating despite the talk of currency wars. Gold is an alternate currency and should be a beneficiary under a scenario where global central banks engage in competitive devaluation. However, the price of gold is fallen so much that a dark cross, or death cross, is rapidly approaching.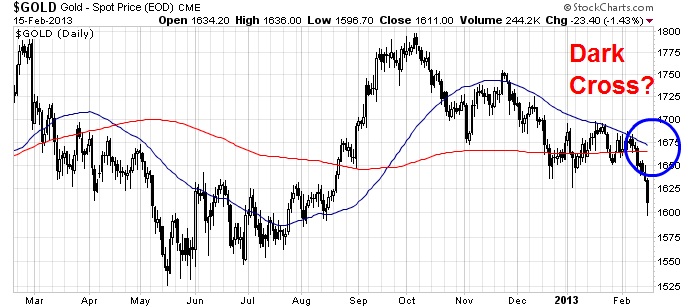
Commodity producers washed out
In the past few months, gold stock investors have fared worse than holders of bullion. I have been a long advocate that gold bulls should hold bullion rather than the shares (see Where is the leverage to gold? as one of many examples of previous posts on this topic). However, we may be approaching a point where traders could tactically favor gold stocks over bullion.
The graph below show the ratio of the Amex Gold Bugs Index (HUI) against the price of gold charted on a weekly basis. I have further overlaid a 14-week RSI on the top panel. Note that weekly RSI is now below 30 indicating an oversold reading. Past oversold readings have marked points where gold stocks have outperformed gold. In addition, the HUI/gold ratio is nearing the bottom of 2008, when investors dumped gold stocks in a bout of panic selling.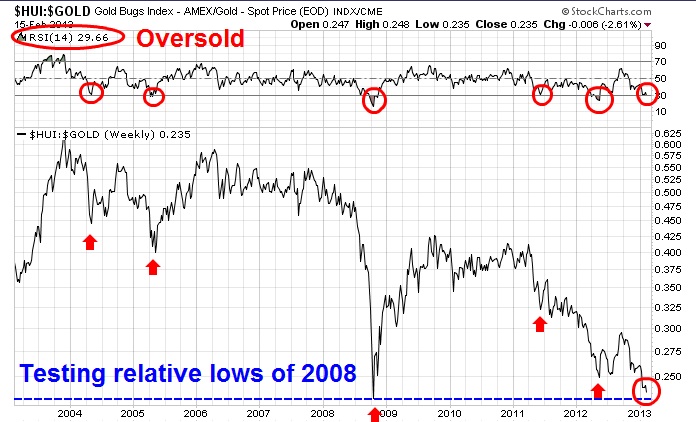
An analysis of the relative performance mining stocks show a similar pattern. Mining stocks are also approaching a key relative support level marked by the 2008 panic bottom.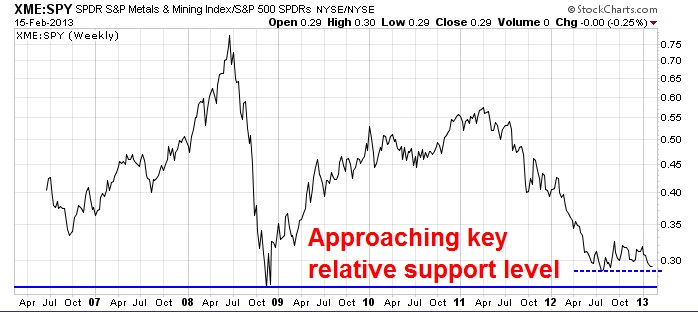
These charts suggest to me that mining stocks are getting washed out and they are poised for a reversal in the months ahead.
Within the resource and commodity producing sector, energy stocks show a more constructive relative performance pattern. The chart below of the relative performance of this sector indicate that energy stocks have rallied through a relative downtrend line, i.e. they've stopped underperforming and a reversal may be close at hand.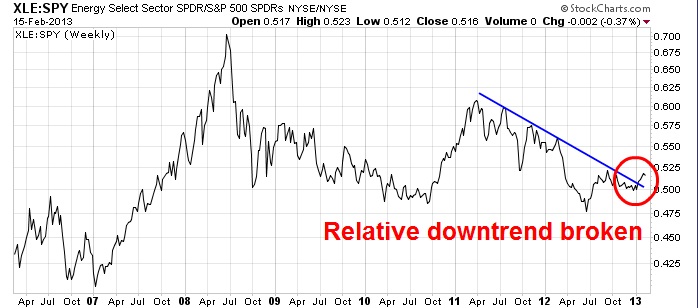
Based on this analysis, my inner investor tells me that it is time to start accumulating positions in energy and mining. My inner trader, on the other hand, wants to dip his toe in the energy sector, play the golds for a bounce and wait for the relative reversal in mining before committing funds.
Disclosures: Cam Hui is a portfolio manager at Qwest Investment Fund Management Ltd. ("Qwest"). This article is prepared by Mr. Hui as an outside business activity. As such, Qwest does not review or approve materials presented herein. The opinions and any recommendations expressed in this blog are those of the author and do not reflect the opinions or recommendations of Qwest.
None of the information or opinions expressed in this blog constitutes a solicitation for the purchase or sale of any security or other instrument. Nothing in this article constitutes investment advice and any recommendations that may be contained herein have not been based upon a consideration of the investment objectives, financial situation or particular needs of any specific recipient. Any purchase or sale activity in any securities or other instrument should be based upon your own analysis and conclusions. Past performance is not indicative of future results. Either Qwest or Mr. Hui may hold or control long or short positions in the securities or instruments mentioned.
- English (UK)
- English (India)
- English (Canada)
- English (Australia)
- English (South Africa)
- English (Philippines)
- English (Nigeria)
- Deutsch
- Español (España)
- Español (México)
- Français
- Italiano
- Nederlands
- Português (Portugal)
- Polski
- Português (Brasil)
- Русский
- Türkçe
- العربية
- Ελληνικά
- Svenska
- Suomi
- עברית
- 日本語
- 한국어
- 简体中文
- 繁體中文
- Bahasa Indonesia
- Bahasa Melayu
- ไทย
- Tiếng Việt
- हिंदी
Time To Buy Gold And Commodity Stocks?
Published 02/19/2013, 04:25 AM
Updated 07/09/2023, 06:31 AM
Time To Buy Gold And Commodity Stocks?
3rd party Ad. Not an offer or recommendation by Investing.com. See disclosure here or
remove ads
.
Latest comments
Install Our App
Risk Disclosure: Trading in financial instruments and/or cryptocurrencies involves high risks including the risk of losing some, or all, of your investment amount, and may not be suitable for all investors. Prices of cryptocurrencies are extremely volatile and may be affected by external factors such as financial, regulatory or political events. Trading on margin increases the financial risks.
Before deciding to trade in financial instrument or cryptocurrencies you should be fully informed of the risks and costs associated with trading the financial markets, carefully consider your investment objectives, level of experience, and risk appetite, and seek professional advice where needed.
Fusion Media would like to remind you that the data contained in this website is not necessarily real-time nor accurate. The data and prices on the website are not necessarily provided by any market or exchange, but may be provided by market makers, and so prices may not be accurate and may differ from the actual price at any given market, meaning prices are indicative and not appropriate for trading purposes. Fusion Media and any provider of the data contained in this website will not accept liability for any loss or damage as a result of your trading, or your reliance on the information contained within this website.
It is prohibited to use, store, reproduce, display, modify, transmit or distribute the data contained in this website without the explicit prior written permission of Fusion Media and/or the data provider. All intellectual property rights are reserved by the providers and/or the exchange providing the data contained in this website.
Fusion Media may be compensated by the advertisers that appear on the website, based on your interaction with the advertisements or advertisers.
© 2007-2024 - Fusion Media Limited. All Rights Reserved.
