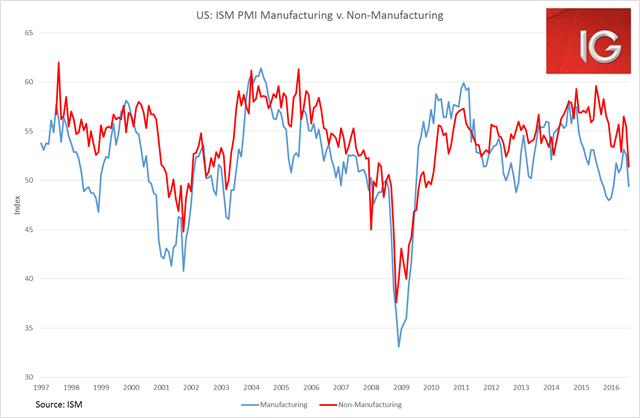
- US ISM Non-Manufacturing PMI collapses to 51.4 from 55.5
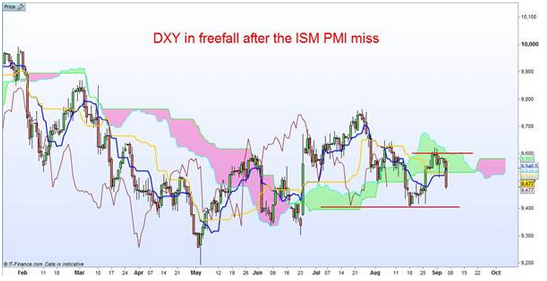
- DXY US dollar index drops 1%
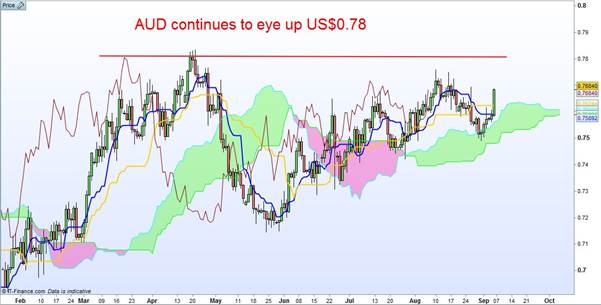
- AUD/USD +1.29% to 0.768
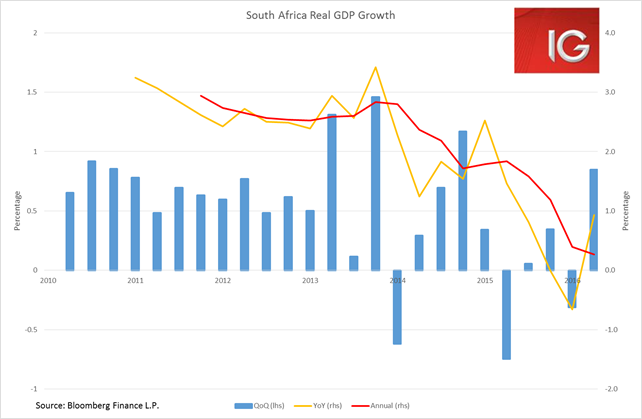
- ZAR/USD gains 2.6% off strong 2Q GDP, EMFX as a whole moves higher
- WTI crude +0.9% to $44.85
- Gold +2% to $1353.40
- ASX SPI Futures point 8 point decline at open
- Economic data: Australia 2Q GDP, China foreign reserves
Well, after a month of hawkish Fed talk, the trifecta of terrible ISM manufacturing and non-manufacturing PMIs and weaker than expected non-farm payrolls have left the quixotic calls for September rate hike dead in the water. And the past two weeks of immensely hard won gains in the US dollar were effectively wiped off in one session. The DXY US dollar index lost 1% overnight and dropped back into the 94 handle.

This was great news for under pressure commodities and emerging markets. South Africa kicked the rally off yesterday as it reported a 0.8% quarter-on-quarter expansion in GDP after a 0.3% contraction in the first quarter. This was the biggest quarterly gain since 4Q 2014 and helped the ZAR gain 2.6% on the day. But EMFX as whole moved higher as to be expected with such a dramatic collapse in the US dollar with particularly big gains by the BRL and MXN as well.

While it’s all fun and games to see highly respected analysts’ calls for September rate hikes get roundly pummelled by the data, the turn in the data is actually very concerning. These sorts of unanimous collapses in the manufacturing and non-manufacturing ISM PMIs rarely occur and often bode serious ill for the US economy. While the manufacturing PMI has continued to struggle over the past two years in a higher US dollar environment, the non-manufacturing PMIs collapse from 55.5 to 51.4 has brought it to its lowest level since March 2010. This is no longer a September story, for even a December rate hike to occur on both of the ISM PMIs are going to have to stage quite a rapid recovery in the next month or two.

The rally in commodities, emerging markets and high yielding asset classes, benefit from continued weakness in US economic data. The Aussie dollar is a key beneficiary of such an environment, and it staged a massive 1.35% rally in the overnight session moving as high as US $0.7688. There could well be further upside to it today with 2Q GDP set to be released with market expectations steadily moving higher alongside every new 2Q data release over the past few days. There looks to be a pretty good chance the Aussie will have a US $0.77 handle before the week is out, and if things go in its favour a retest of the US $0.78 level could soon be in store.

US equities did not take the data miss well, the only winners were commodity-related stocks and the yield plays such as utilities and telecoms. This does not set the Asia-Pacific session up for a great open with most markets looking to open lower. Although, in Australia the materials and energy space are set for a good day. BHP’s ADR gained 3.2% and CBA’s gained 2%, which actually points to potentially a better session today than the SPI futures are currently suggesting.
