Talking Points:- "Steamroller" Momentum in AUD/CAD
- Textbook Pullback to Daily Support
- The Key Support Zone for Buying AUD/CAD
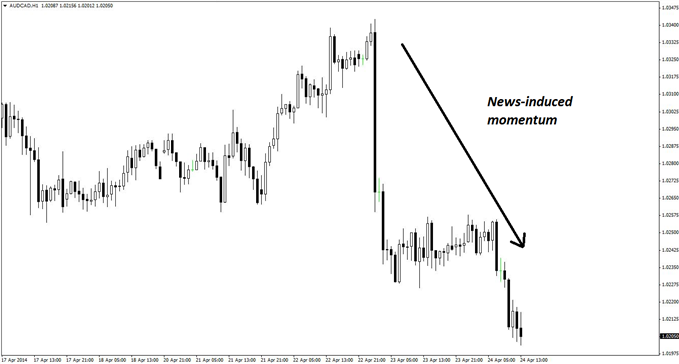
Few traders would be willing to stand in front of a trend that has exhibited a lot of momentum, and that’s precisely what can be seen on the below hourly chart of AUD/CAD.
The last couple days have been extremely volatile for the Australian dollar against all currency counterparts, and as such, many AUD charts look like the one below. As a result, most short-term traders will likely already be short or looking for an AUD short right now. However, for traders who wish to enter on the hourly time frame, it is worth considering how much room is actually left for this downward move to run.
News-Inspired Momentum Move in AUD/CAD
As shown, there have already been two clear legs to the down side in AUD/CAD, and in spite of the steamroller-type momentum, there are bigger-picture factors that suggest that there may be at least a pause or bullish reaction in the near future.
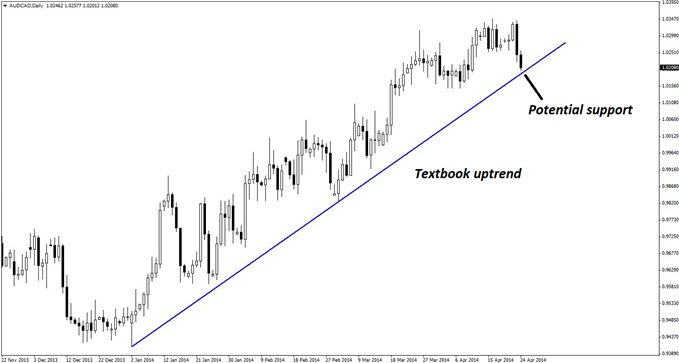
The daily chart below shows this proposition very clearly, with prices pulling back to an extremely obvious rising support line. Given that this upward move has been in progress since January 2014, it seems reasonable to assume that residual bulls watching this time frame will give the upside one more try. As there are more than 130 pips of potential upward movement from the nearby trend line, and because this is such a textbook pattern, it seems worthy of a trade or two on the lower time frames.
Textbook AUD/CAD Pullback to Support
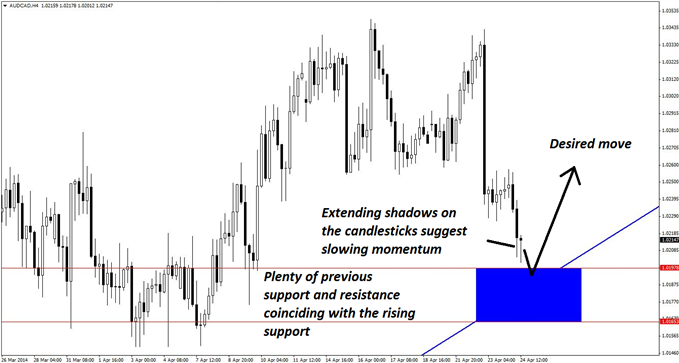
The four-hour chart below tells the story even more definitively, showing an obvious zone of confluence support. From this four-hour perspective, the most telling feature about this pullback is the lengthening candle wicks as price approaches the support zone. Nonetheless, in order to respect the extreme bearish momentum seen recently, the zone selected is 1.0165-1.0197, which is a little further away than it might otherwise be.
Key Support Zone for Buying AUD/CAD
In spite of everything, this support zone is only a mere 32 pips deep, which satisfies even more stringent risk considerations. Nonetheless, an entry on the hourly time frame would be preferable for this trade, using pin bars, bullish engulfing patterns, and/or bullish reversal divergence as viable entry signals. All that remains at this point would be to wait for price to touch the highlighted support zone.
Of course, two or three attempts may be required in order to effectively enter and stay in this trade. By selecting a support zone that is slightly further away from the current price, the hope is that any last-minute choppiness will be accounted for. However, a notable disadvantage is that if price suddenly turns around before touching the blue box, traders could potentially miss out on this move.
By Kaye Lee, private fund trader and head trader consultant, StraightTalkTrading.com.


