Introduction
Generally speaking, the overall stock market is fully valued at best, and in many cases significantly overvalued. Therefore, it is very challenging to find sound and attractive stocks to invest in today. The challenge to find good value today is even more pronounced for the prudent dividend growth investor. Low interest rates and a flight to quality have driven the prices of best-of-breed dividend growth stocks to unprecedented highs.
The premier universe of dividend growth stocks is the S&P’s Dividend Aristocrats. This elite list of blue-chip dividend growth stocks is comprised of companies that have increased their dividends for at least 25 consecutive years, and many on the list have streaks that are even much longer than that. If a long-term increasing dividend income stream is your objective, then the Dividend Aristocrats should be the first place you look for dividend growth investments. It is certainly the primary place where I like to look for good dividend growth stocks.
In preparation for this article, I examined the valuations of the 50 stocks comprising the S&P’s Dividend Aristocrats. This is a process that I have routinely engaged in for many years because currently my personal investment objective is for accumulating a growing dividend income stream. Normally, I find this prestigious list a virtual treasure trove of ideas and opportunities for attractive dividend growth stock investments. However, much to my chagrin my most recent review uncovered a mere seven companies that I would even consider for current investment based on my strict valuation criteria.
With this article, I will review the seven S&P’s Dividend Aristocrats that I consider attractive and sound dividend growth investments in today’s overheated stock market. However, I thought it might be insightful for the reader to identify the problem before I presented the scarce few potential research candidate solutions I found.
The Flight to Quality-Destination Danger
McCormick & Company (NYSE:MKC)
One of my all-time favorite dividend growth stocks is the spice company McCormick & Company. Although any reader that’s ever walked into a grocery store is most likely familiar with this company and its iconic brands of spices, I offer the following short business description courtesy of S&P Capital IQ for a deeper insight:
“McCormick & Company, Incorporated manufactures, markets, and distributes spices, seasoning mixes, condiments, and other flavorful products to the food industry. It operates through two segments, Consumer and Industrial.
The consumer segment offers spices, herbs, seasonings, and dessert items. It provides its products under the McCormick, Lawry’s, Stubb's, and Club House brands in the Americas; Ducros, Schwartz, Kamis, and Drogheria & Alimentari brands, as well as Vahiné brand in Europe, the Middle East, and Africa; McCormick and DaQiao brands in China; McCormick and Aeroplane brands in Australia; and Kohinoor brand in India, as well as through regional and ethnic brands, such as Zatarain’s, Thai Kitchen, and Simply Asia. This also supplies its products under the private labels. This segment serves retailers, including grocery, mass merchandise, warehouse clubs, discount and drug stores, and e-commerce retailers directly and indirectly through distributors or wholesalers.
The Industrial segment offers seasoning blends, spices and herbs, condiments, coating systems, and compound and other flavors to multinational food manufacturers and foodservice customers. It serves foodservice customers directly and indirectly through distributors.
The company was founded in 1889 and is based in Sparks, Maryland.”
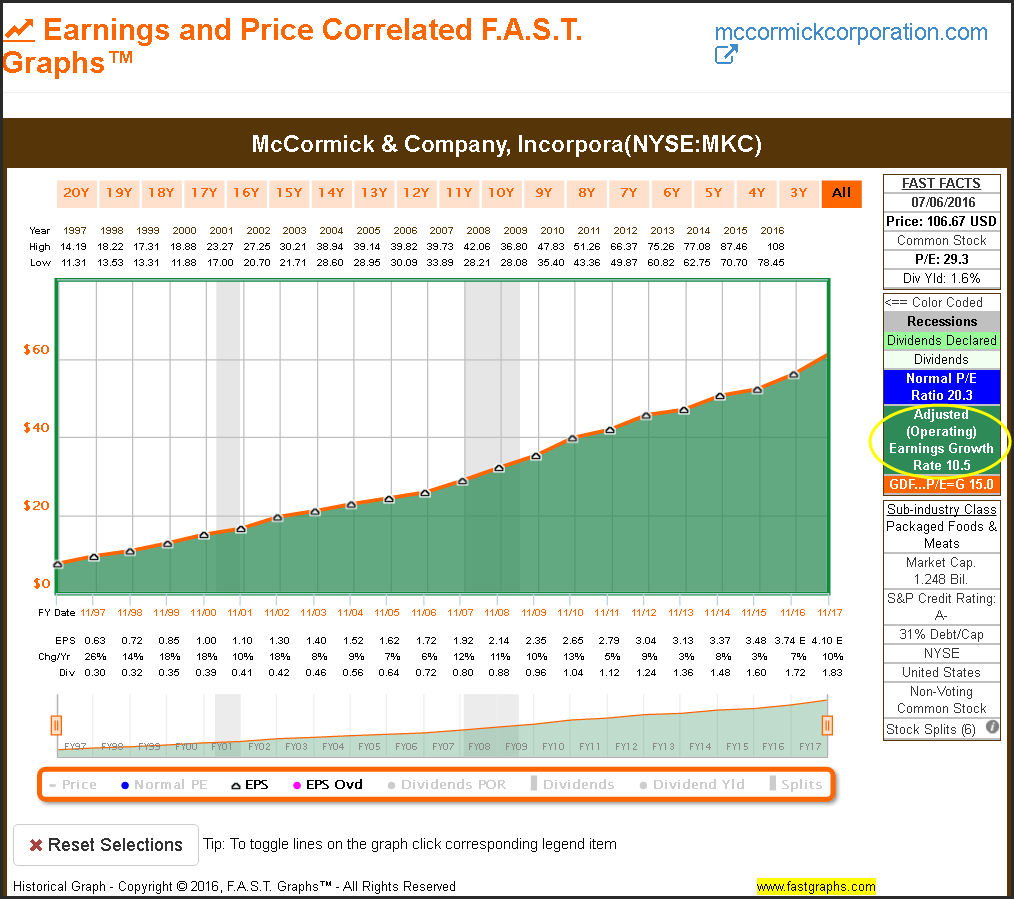
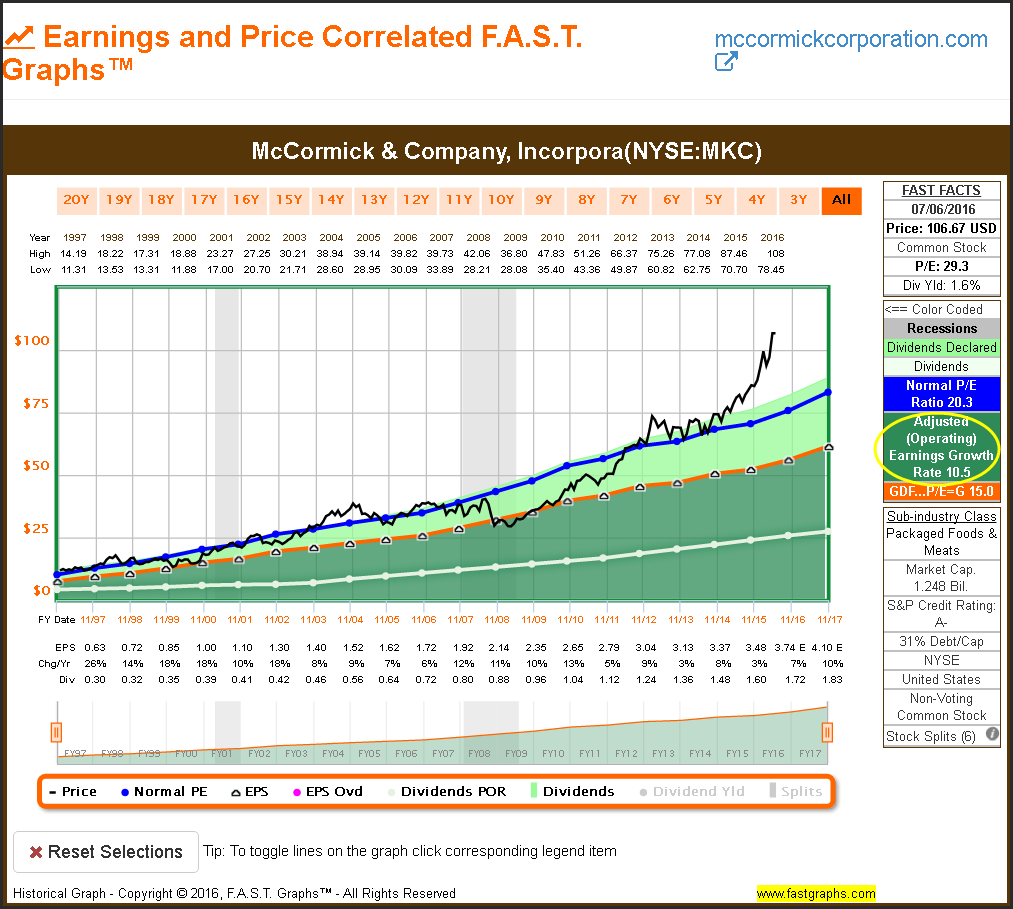
The following series of F.A.S.T. Graphs™ on McCormick & Company clearly illustrates why I admire this company so much. The first graph plots McCormick’s earnings per share since 1997. As you can see, you would be hard-pressed to find a company that has produced a more consistent record of earnings growth over the past couple of decades. Take special note of the company’s earnings growth rate achievement of 10.5% per annum over this timeframe. Also note that the orange valuation reference line represents a P/E ratio of 15 with the line growing at 10.5% over this timeframe. McCormick represents a quintessential example of the type of business I personally covet the most.
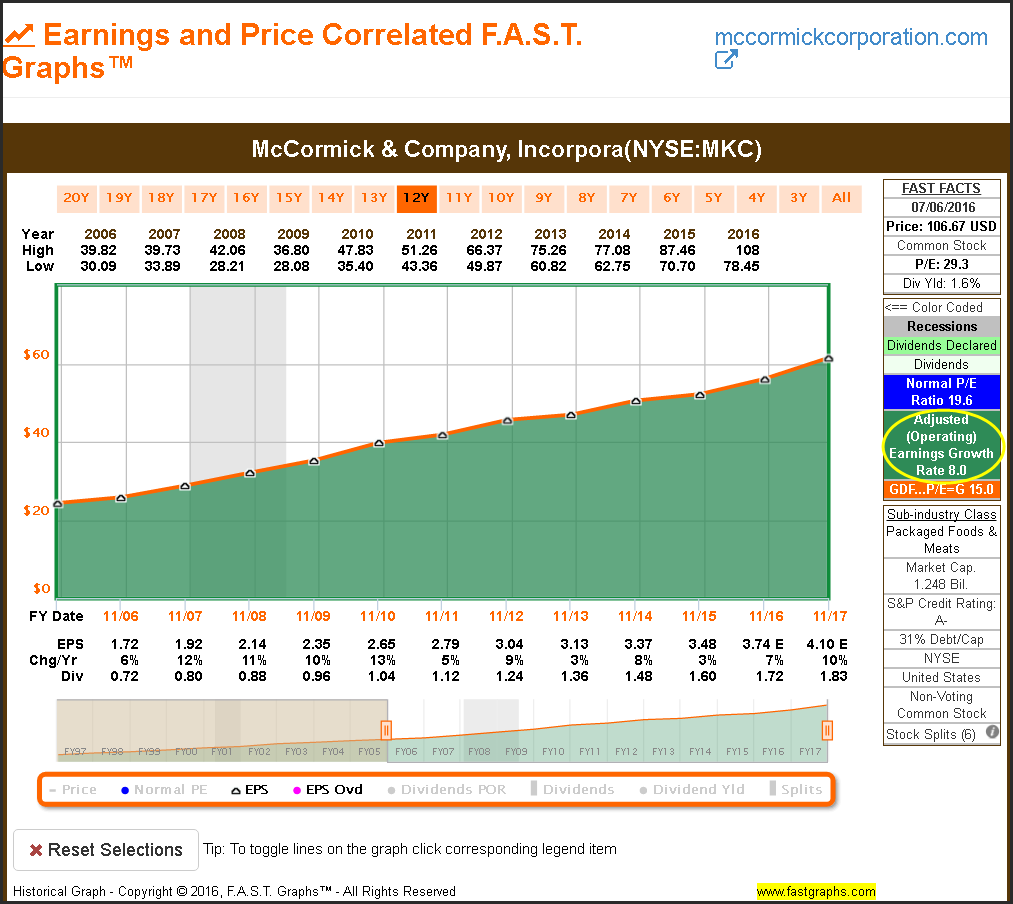
With my next two graphs I shorten the timeframes in order to illustrate a very important point relating to this company’s earnings growth rate achievements over these shorter periods of time. The following graph plots McCormick’s earnings and earnings growth rate since 2006. Note that the earnings growth rate has now dropped to 8% per annum. The fair value P/E ratio reference remains at 15, but with this example the growth of the orange line is lower at 8% per annum.
With this next graph, I have shortened the timeframe once again from 2011 to current. We continue to see the incredible consistency of McCormick’s steadily increasing earnings per share, but we also discover that the earnings growth rate has slowed even more to 6.4% per annum. The same 15 P/E ratio fair valuation reference continues to apply, but over this most recent timeframe the slope or growth of the orange line has now fallen to 6.4%.
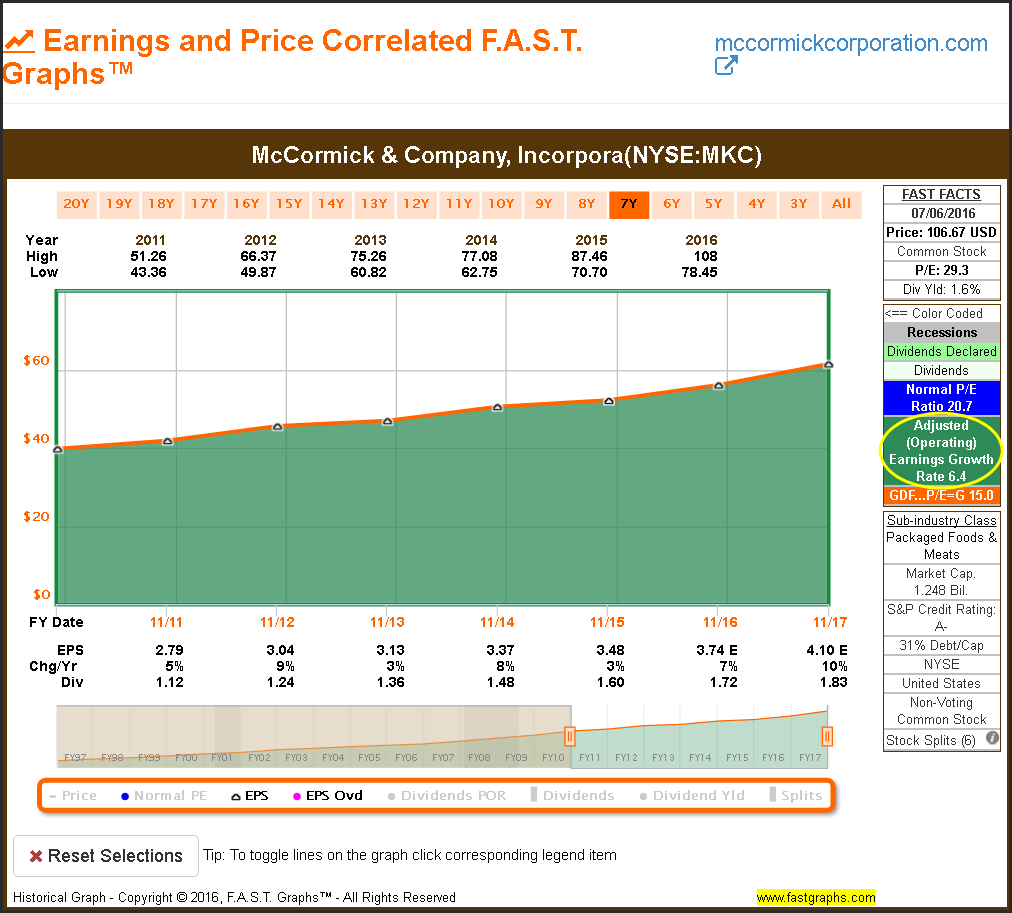
At this point, I would like to summarize what we have discovered thus far by looking at these earnings only graphs on McCormick. The company remains a paragon of earnings growth consistency, however, the company’s earnings growth has clearly slowed down over the more recent time periods. Logic would dictate that because the company is now not growing as fast as it historically has, there should be a corresponding resulting effect on valuation.
Let’s test that logic by adding monthly closing stock prices to the long-term McCormick earnings graph as depicted below. What we discover defies logic. Starting in July 2010, McCormick’s stock price became excessively disconnected from historical norms in spite of the fact that the company’s earnings growth has slowed down a bit. The company’s valuation at a current blended P/E ratio of 29.5 is the highest it has been over this entire time frame, and its dividend yield is currently the lowest it has been.
This begs the question why? Nothing has really changed with this company from a positive perspective, but it has changed from a negative perspective with lower earnings growth. Yet the market is currently valuing the stock at unprecedentedly high valuation levels. Importantly, this is not the first time the market has applied a high valuation to McCormick’s stock, although it is the highest valuation over this historical timeframe. If history is any guide, and as the following graph clearly illustrates, every time the market has applied an excessive valuation to this Dividend Aristocrat it led to periods of underperformance as the stock price logically reverted to the mean fair value P/E ratio of 15.
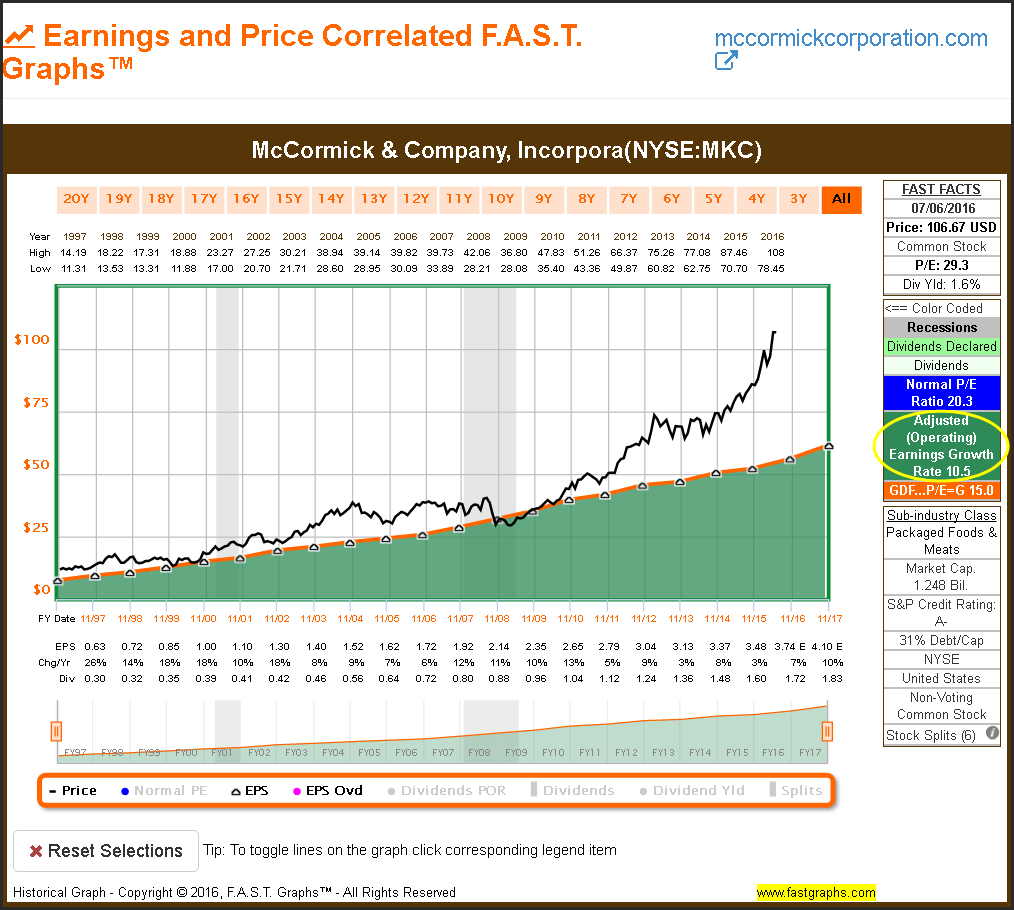
With this final graph I present a complete F.A.S.T. Graphs™ where I have added the important additional fundamental metrics. The earnings (the green shaded area) below the honeydew green line (it looks white), represents McCormick’s dividend payout ratio which has always been consistent at around 40 to 45% of earnings. Nothing has really changed there.
The dark blue historical normal P/E ratio line indicates that the market has a long history of applying a premium valuation to this blue chip. However, McCormick’s recent valuation has taken the premium valuation to the extreme. I continue to admire this high-quality dividend growth stock and company, and even long for the day when I could comfortably and safely invest in it. However, today is not that day.
There are Only 7 of 50 Dividend Aristocrats I Would Consider Investing in Today
There are only seven Dividend Aristocrats that I would consider as attractively valued research candidates currently. The following portfolio review lists them in order of lowest to highest P/E ratios. To put this into perspective, of all the Dividend Aristocrats I would only be willing to invest in 14% of the entire list currently. I believe this speaks volumes about the challenges facing the dividend growth investor in today’s overvalued market.
So what is the prudent dividend growth investor to do? To me, the answer is straightforward. I have often stated that I believe it is a market of stocks and not a stock market. And I have added that in all markets there will always be overvalued, fairly valued and undervalued stocks to be found. Consequently, my advice is to ignore the overall level of the market, and search for value where you can find it.
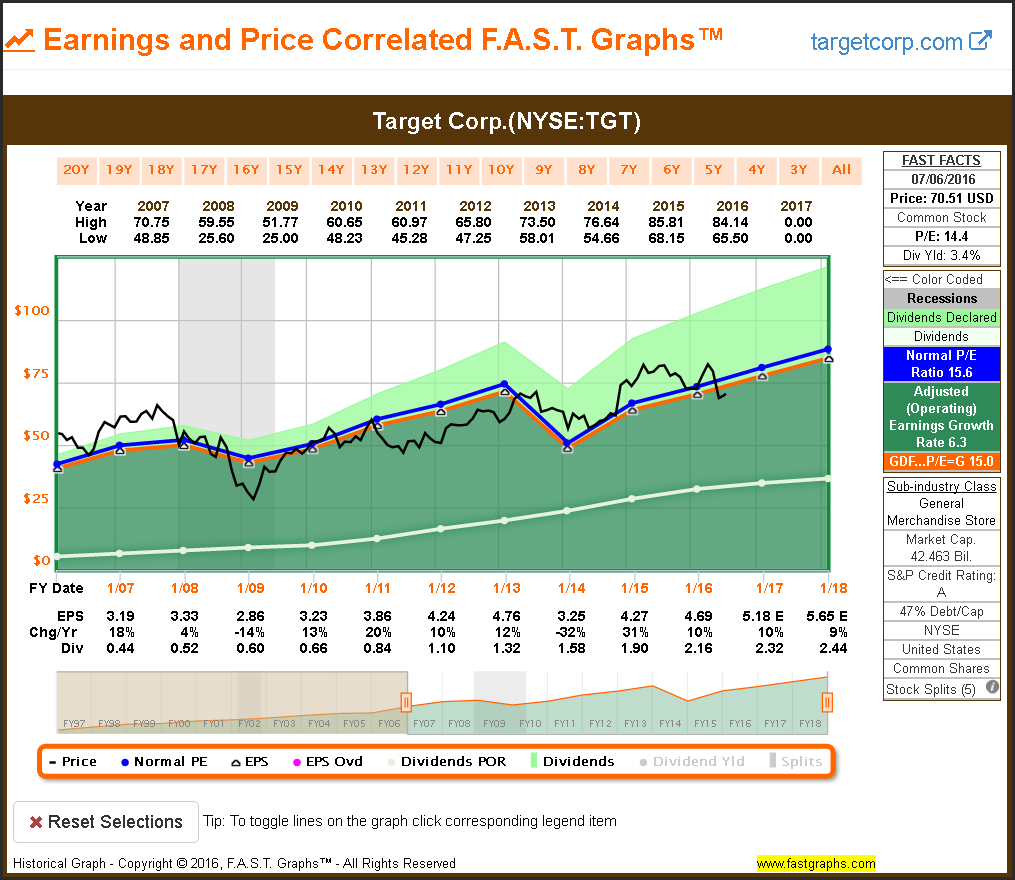
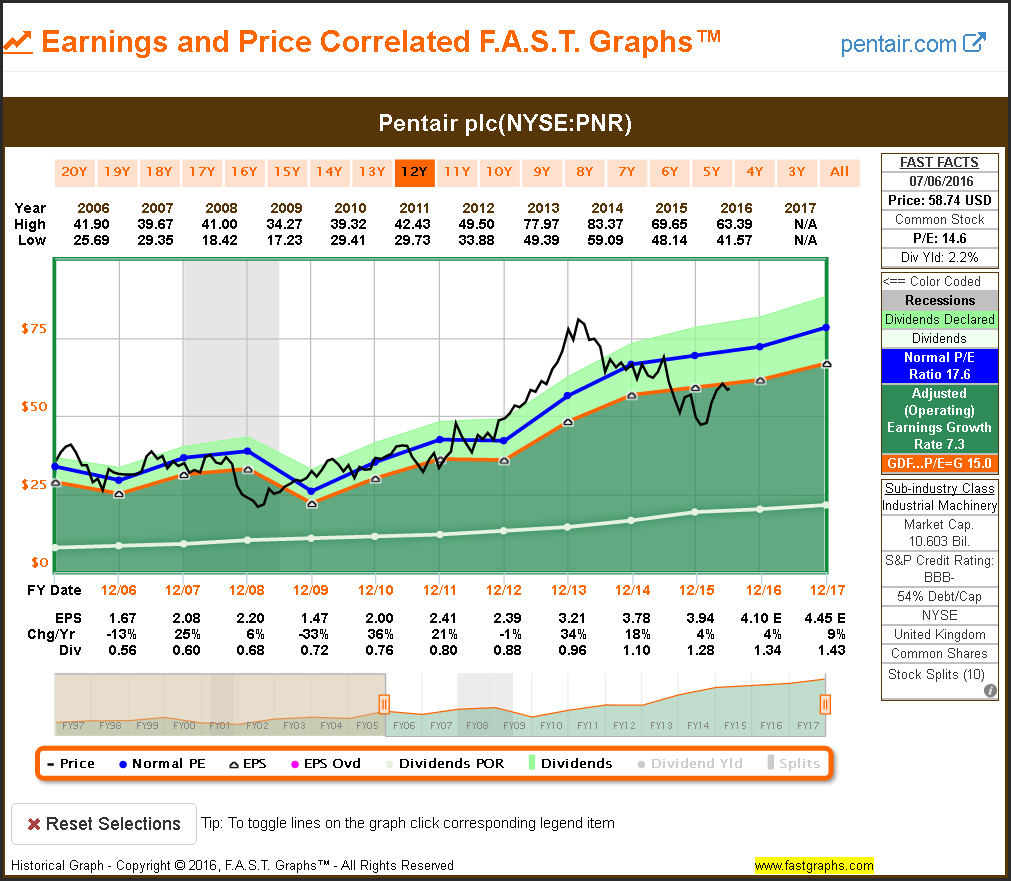
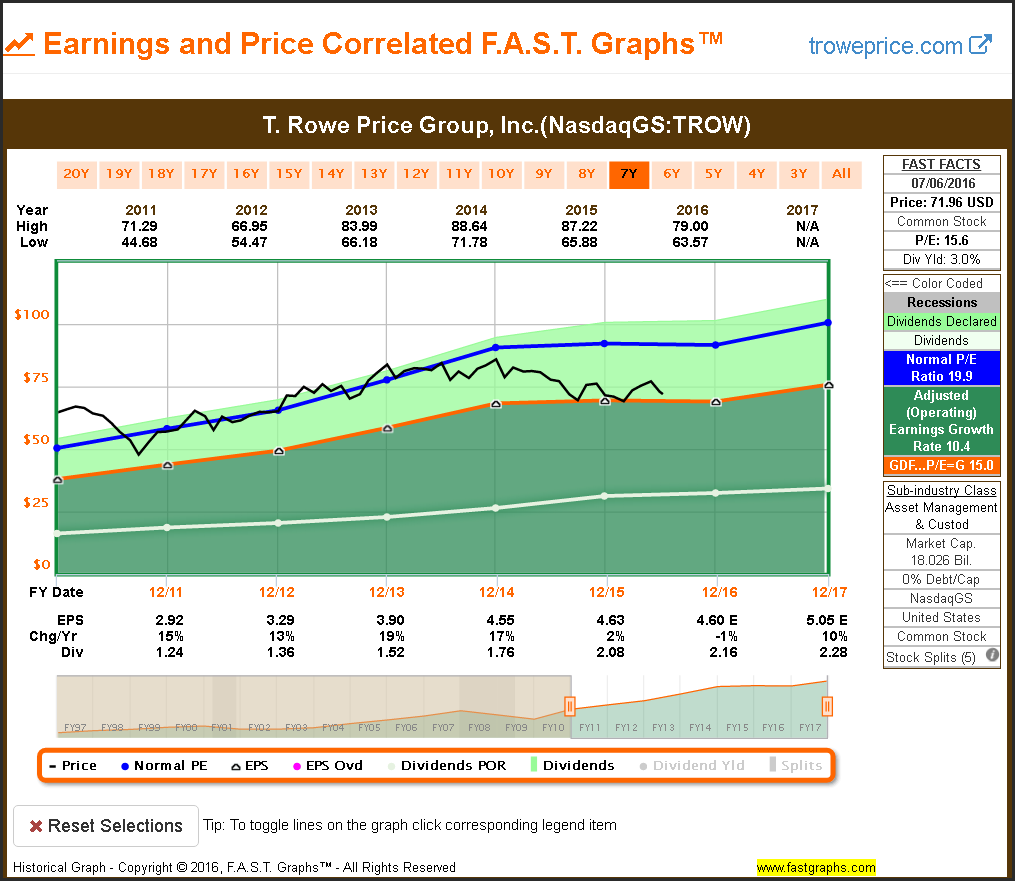
I also believe it’s important to recognize how fair value has manifest on individual companies while the market overall remains overvalued. Of the seven fairly valued research candidates presented below, four of them have become fairly valued after previously being overvalued. In other words, these companies are already experiencing a correction while the market remains high. These companies are Cardinal Health (NYSE:CAH), Pentair (NYSE:PNR), Target (NYSE:TGT) and T Rowe Price (NASDAQ:TROW).
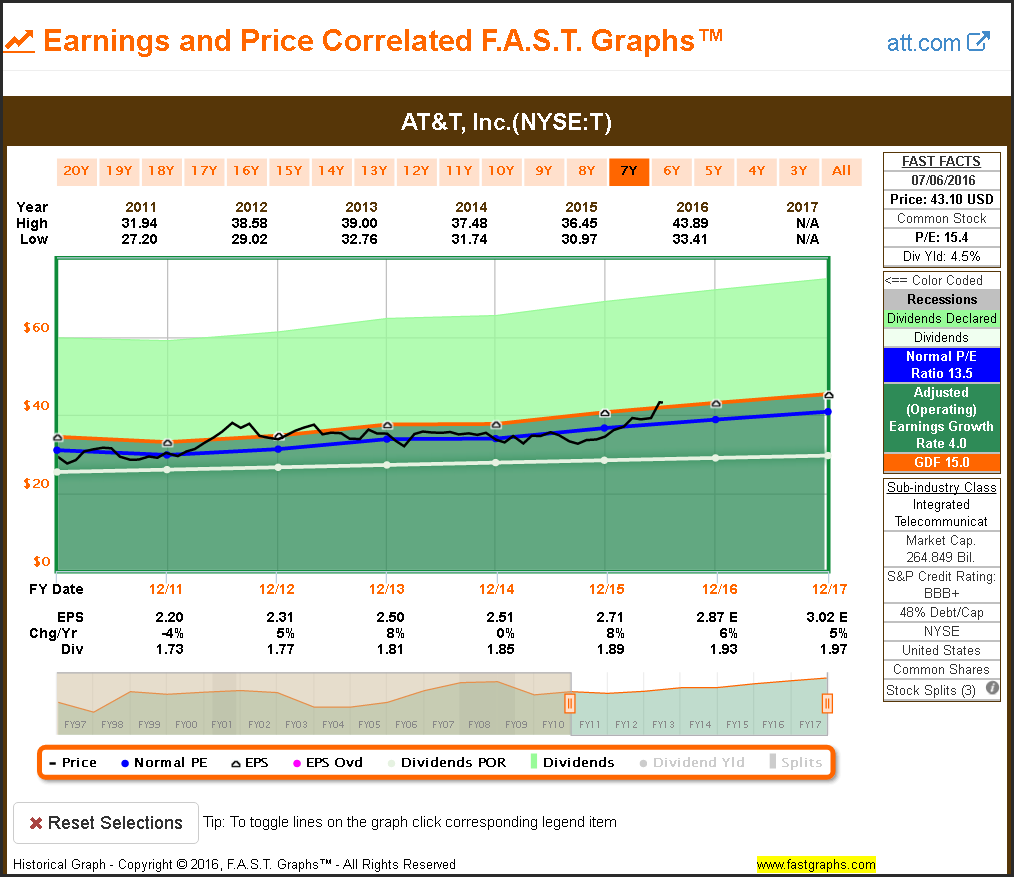
The remaining companies, Aflac Incorporated (NYSE:AFL), AbbVie Inc (NYSE:ABBV). and AT&T Inc. (NYSE:T), have all been reasonably valued for some time. However, each of them has recently been showing signs of life regarding their stock prices. This is especially true of AT&T which I consider on the threshold of becoming overvalued considering it is the lowest growth opportunity amongst the group.

Essential Fundamentals and Relative Valuations at a Glance
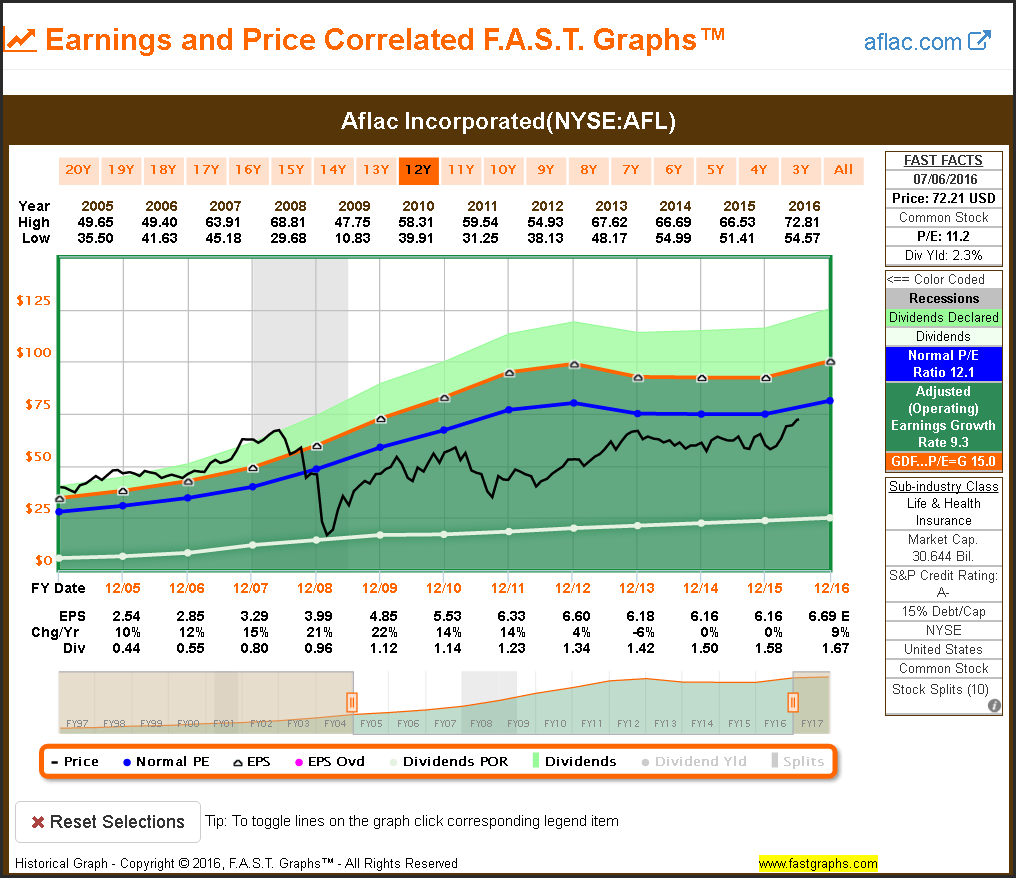
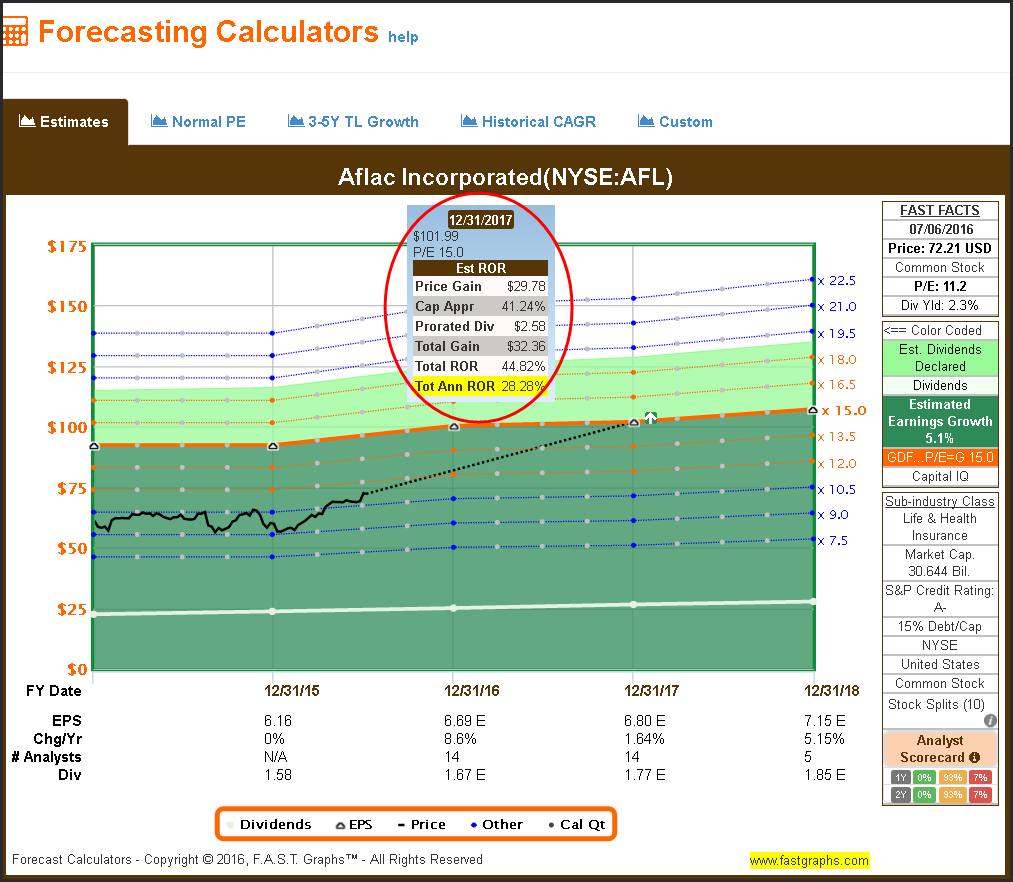
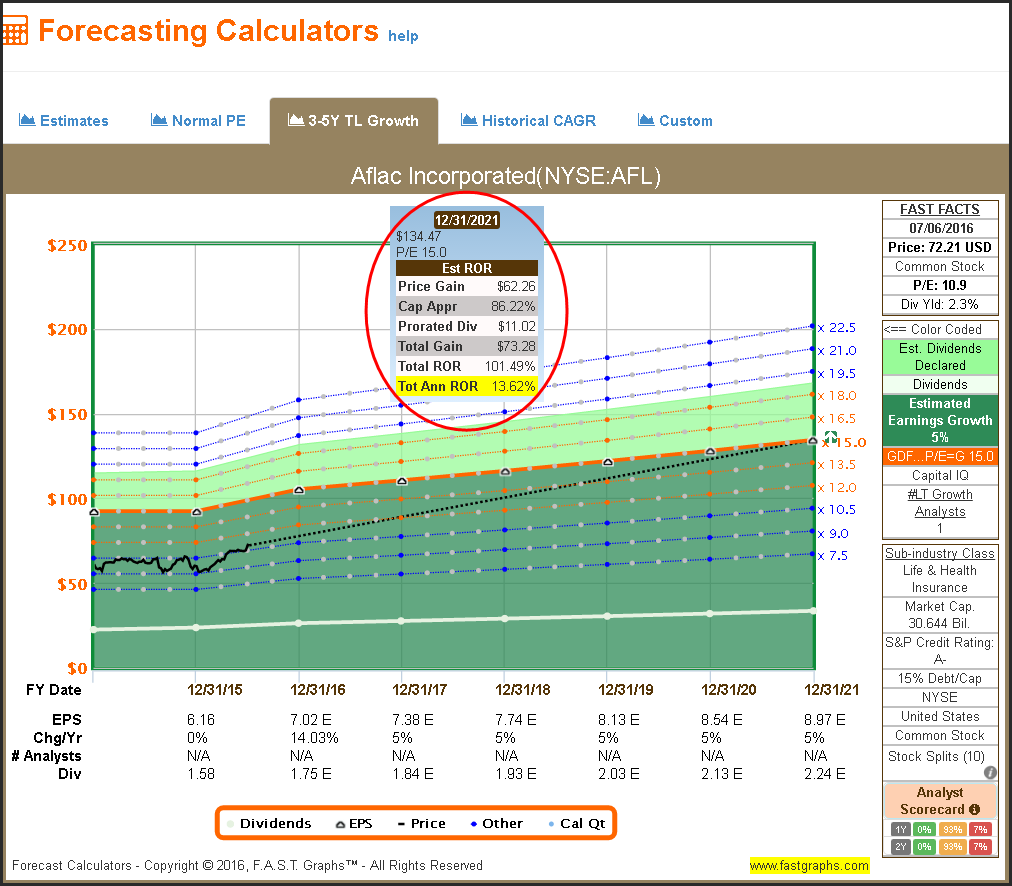
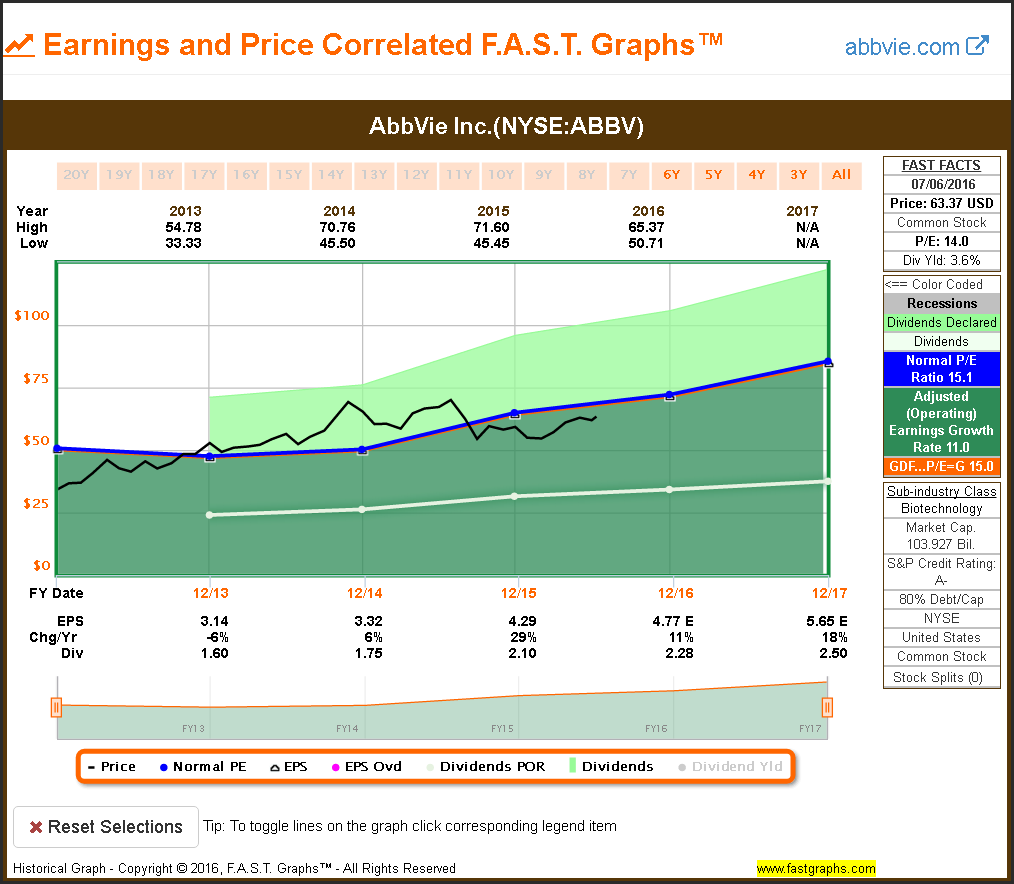
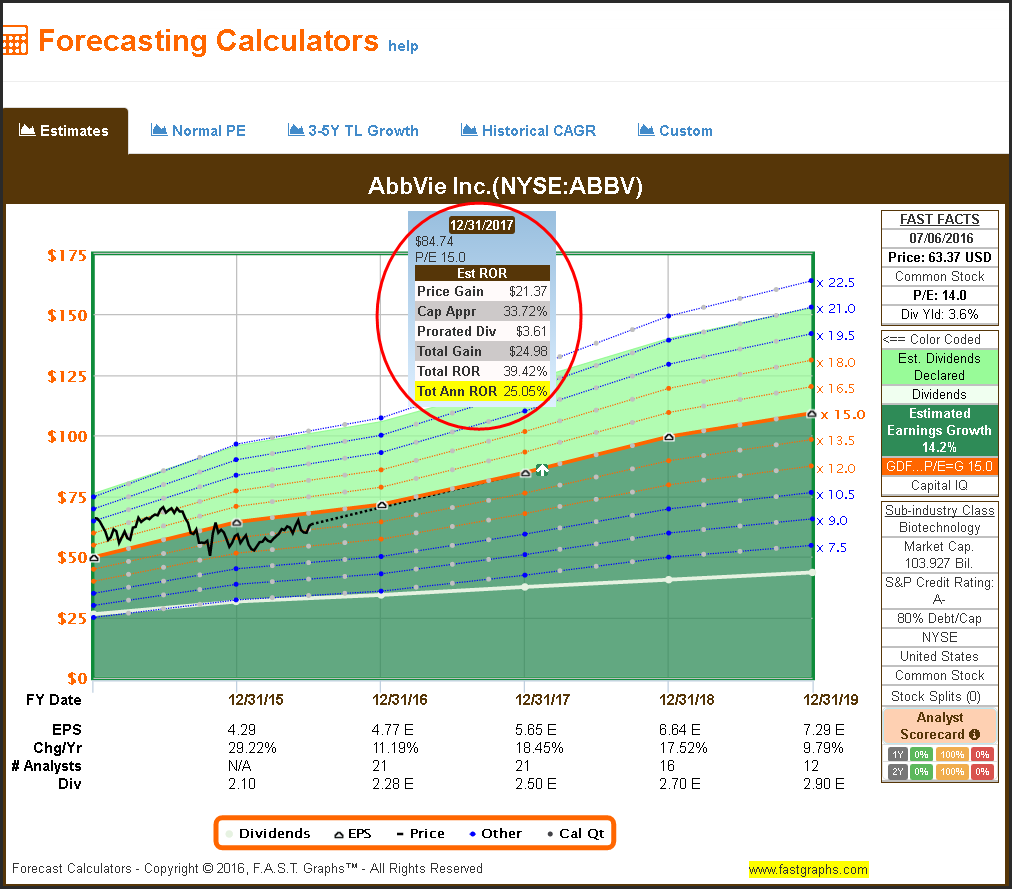
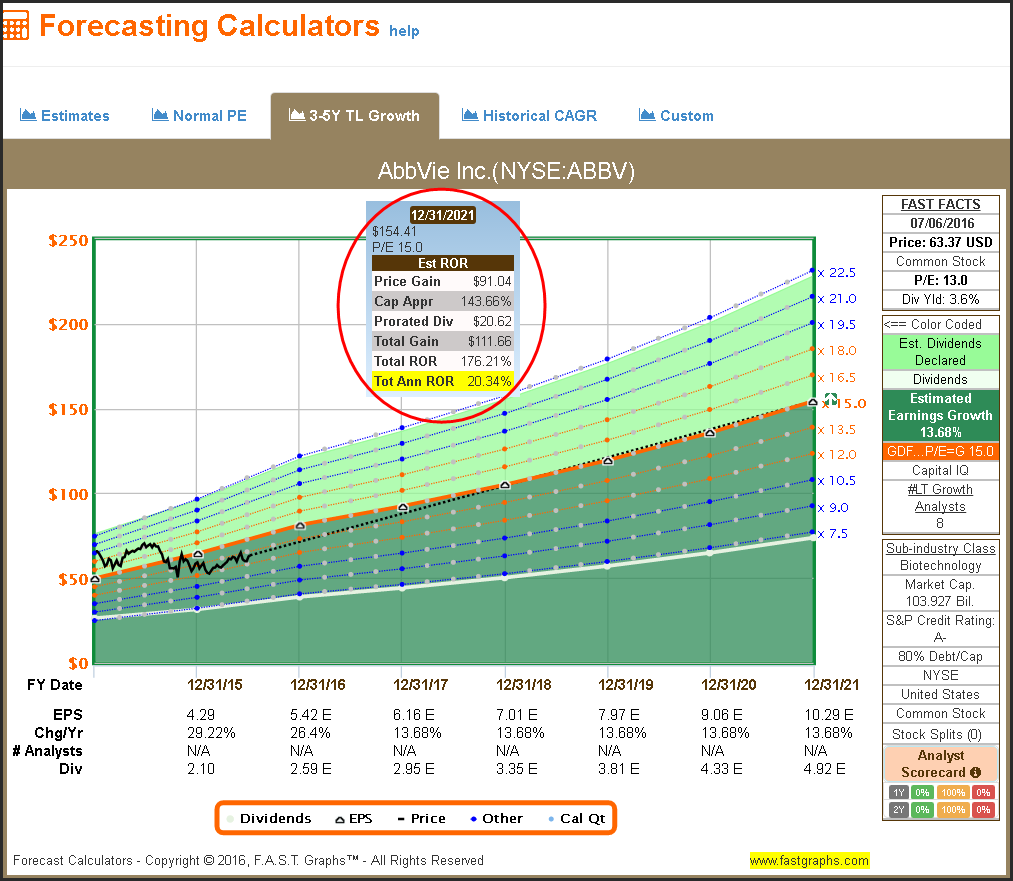
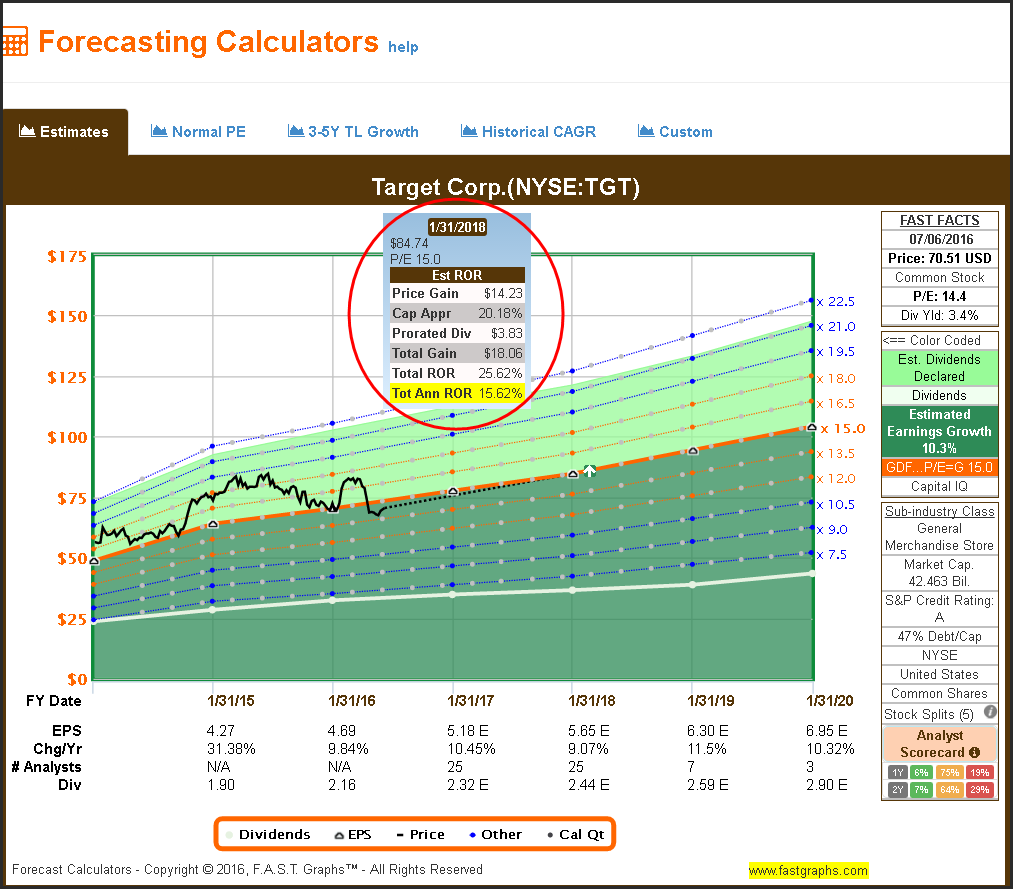
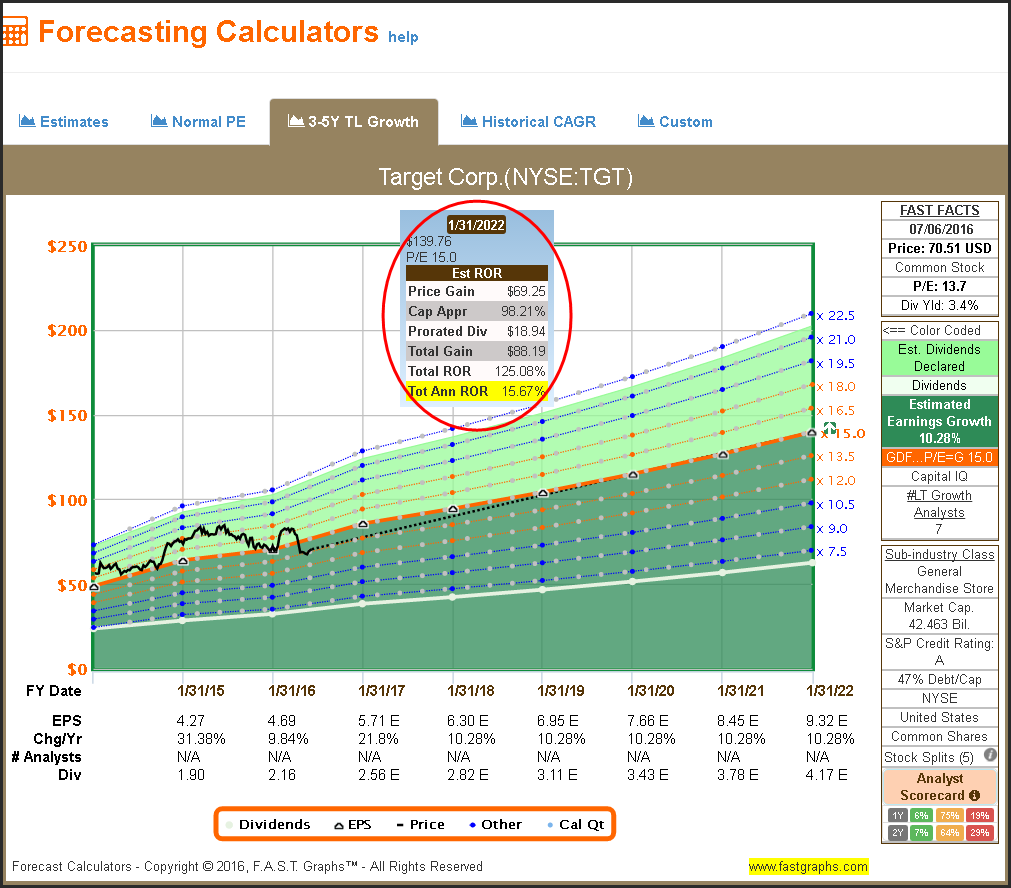
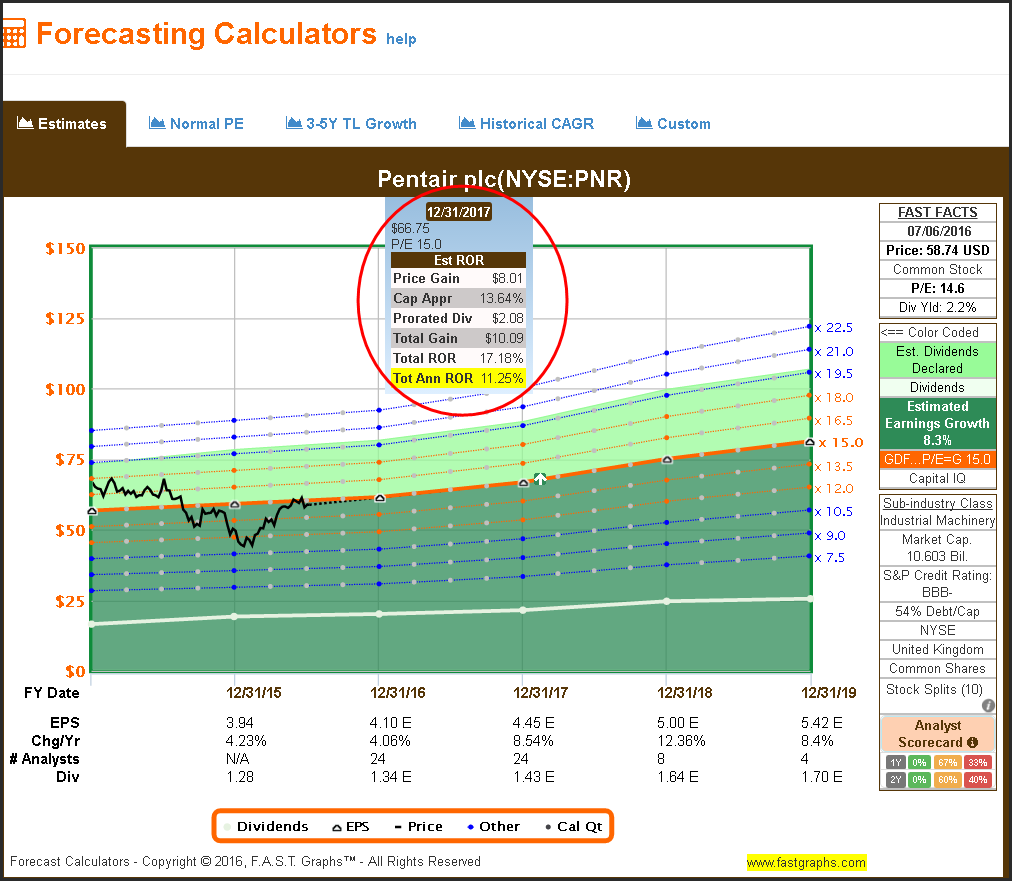
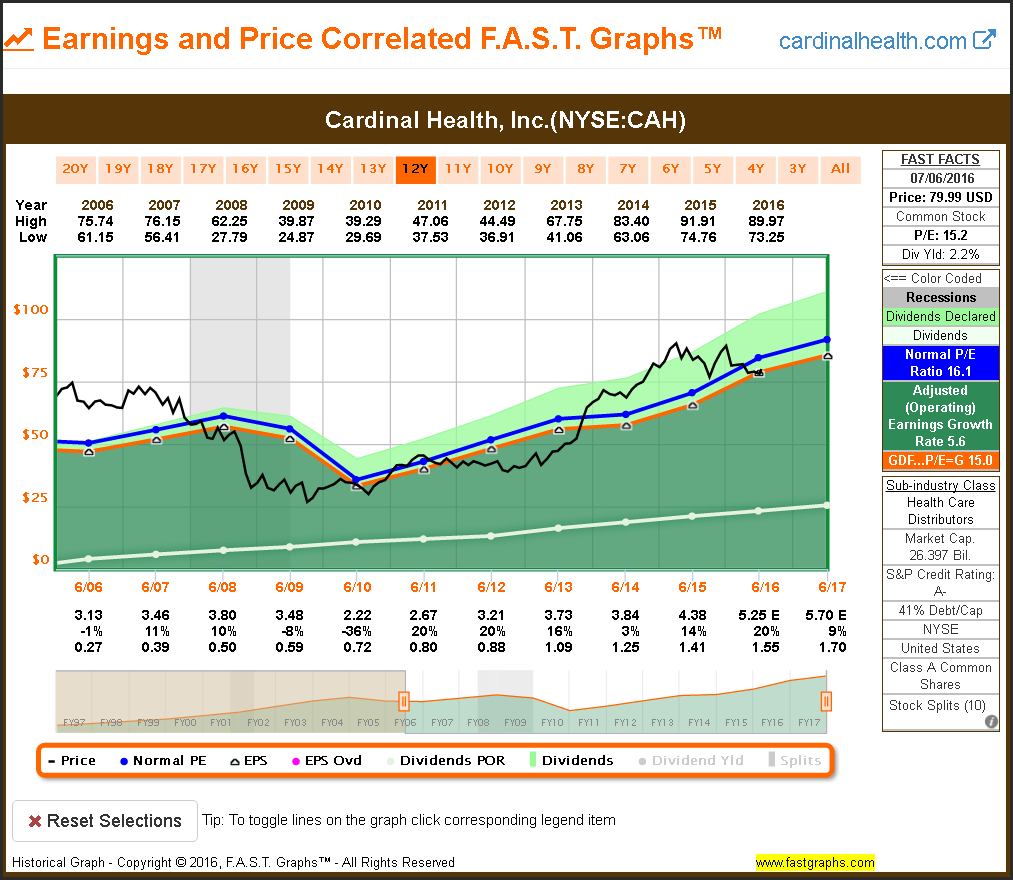
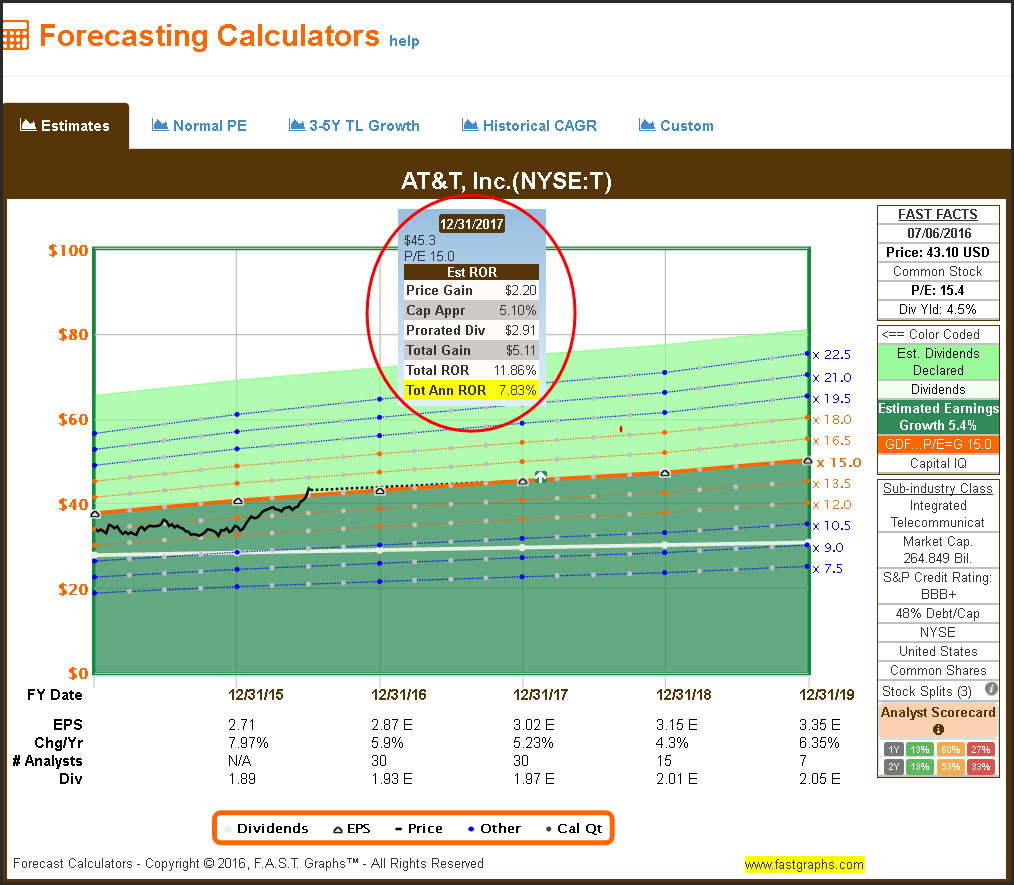
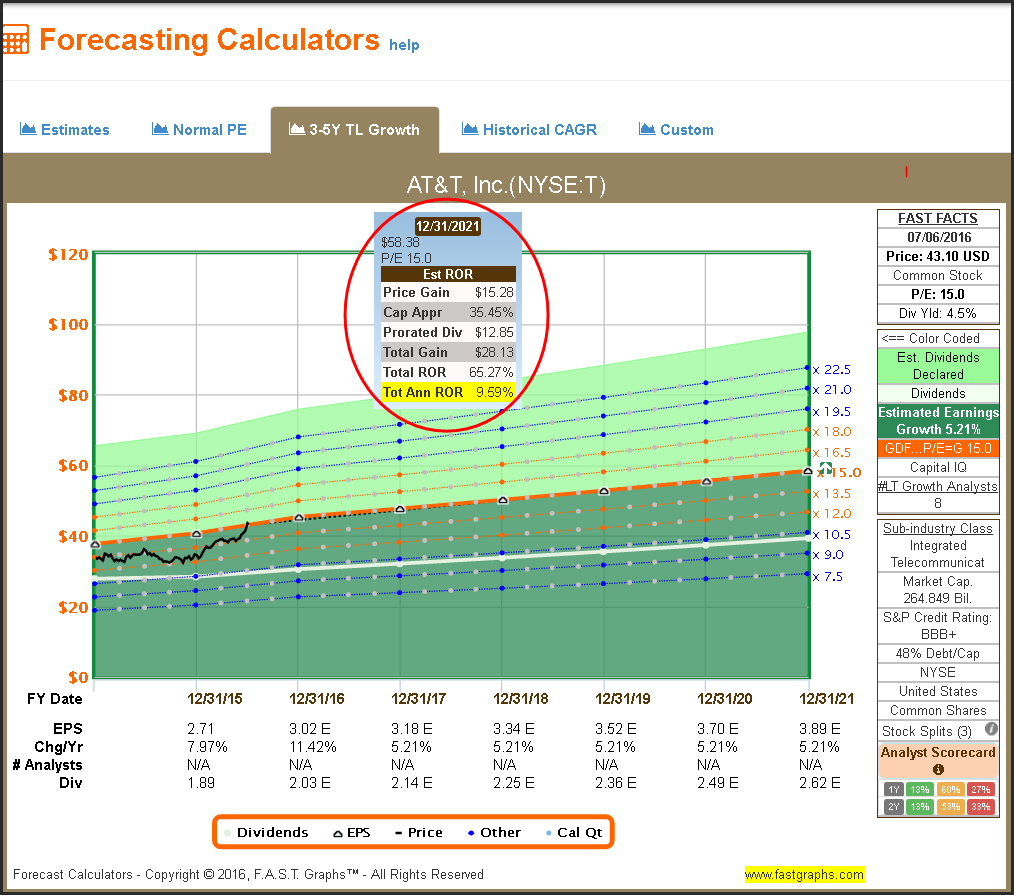
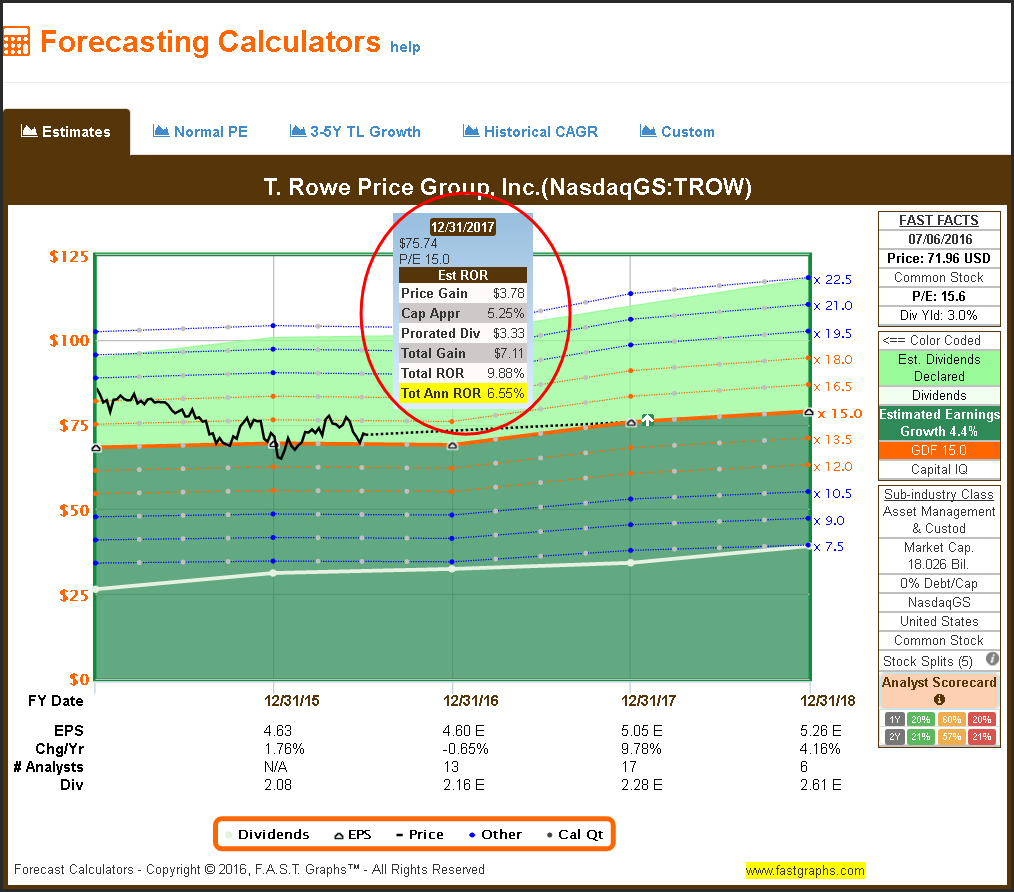
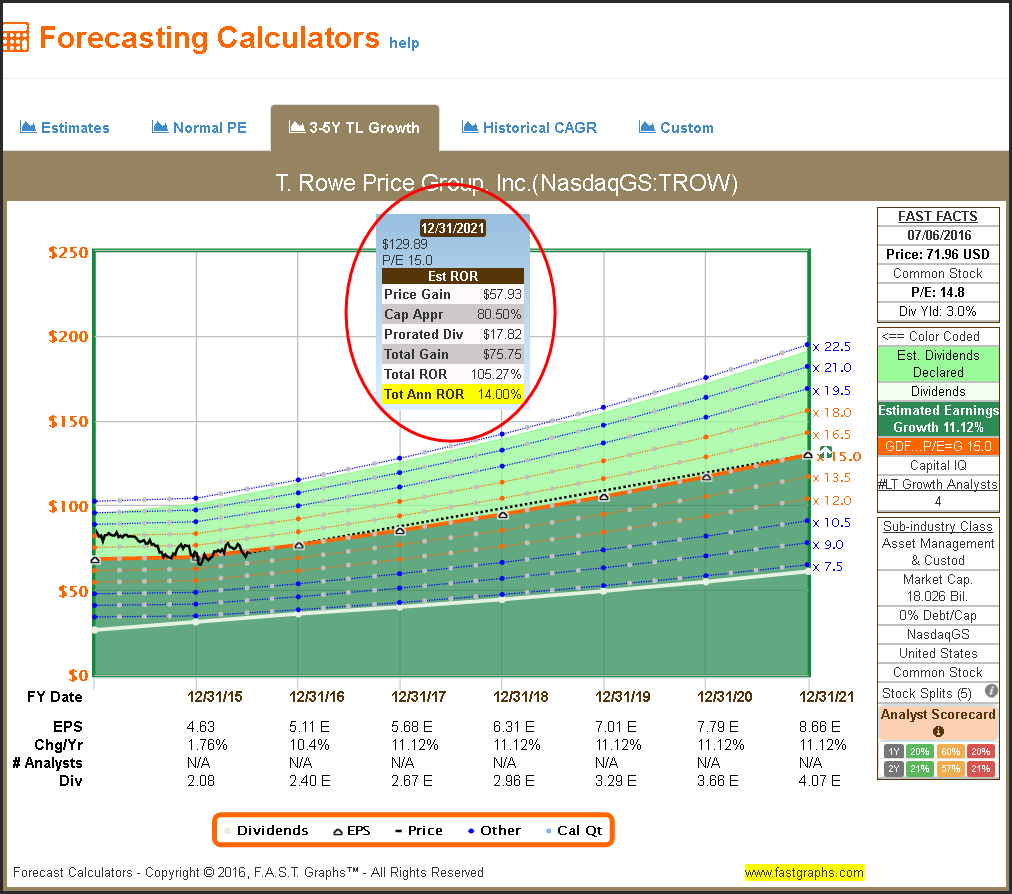
I offer the following historical earnings and price correlated F.A.S.T. Graphs on each of the seven fairly valued Dividend Aristocrats. I’ve also included two Forecasting Calculators based on the two separate earnings estimates provided by S&P Capital IQ. The first are specific earnings estimates for the next fiscal year or two. The second estimate set is a long-term trend line growth rate.
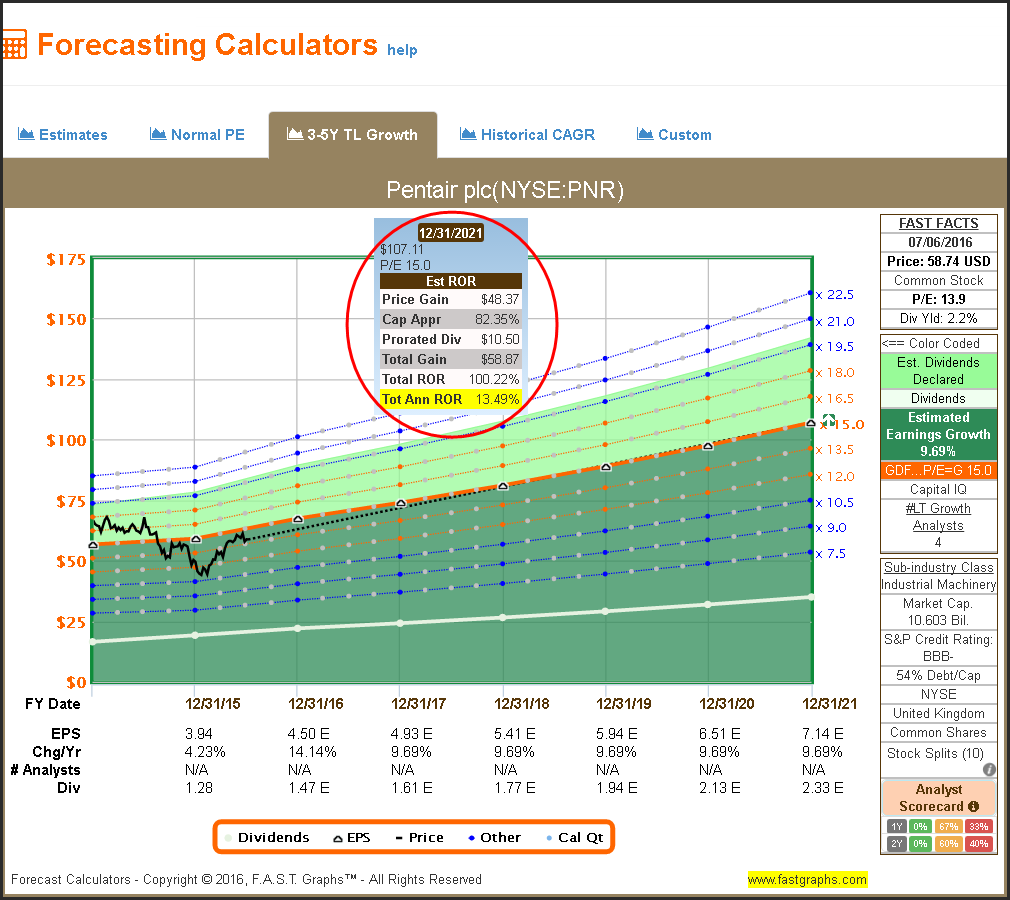
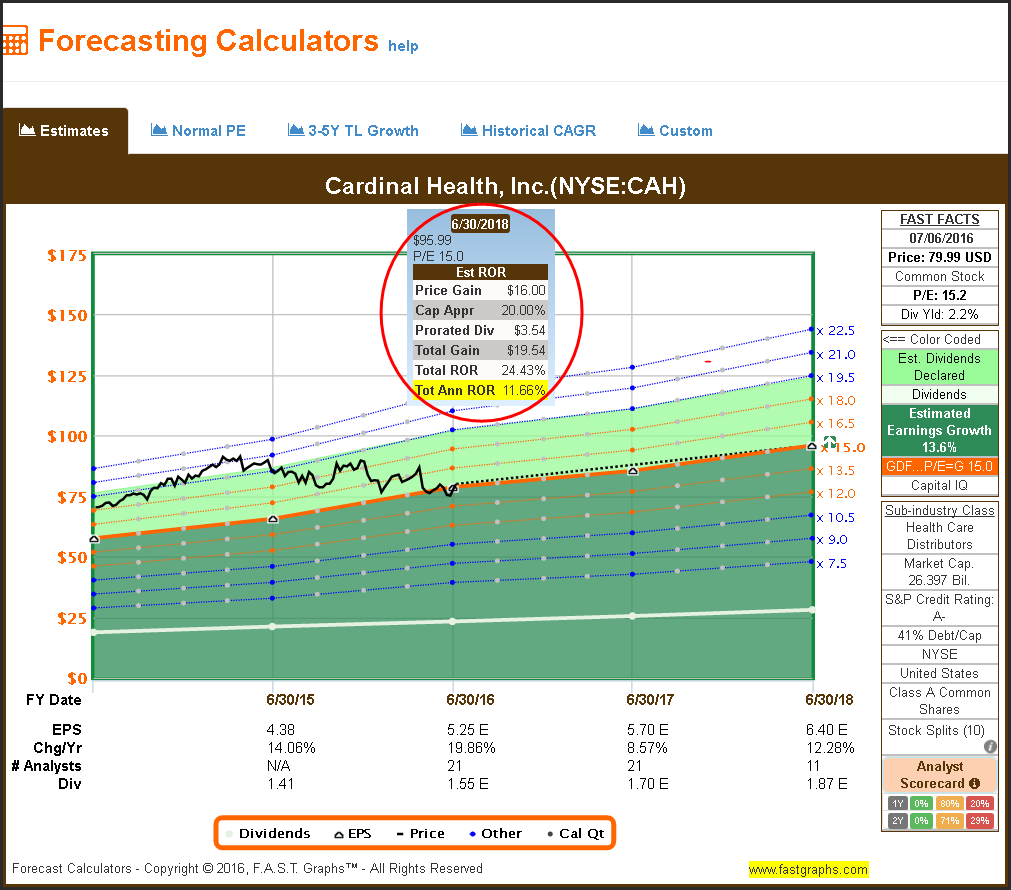
The first forecasting calculator presented looks at near term consensus analyst estimates on each company with a focus on the current year and the next year. Included is a “what-if” calculation of what the potential rate of return would be over the next few years if the companies achieved the analysts’ consensus earnings estimates and their stock subsequently traded at fair value based on those estimates. Although this is hypothetical, it illustrates the potential returns each of these research candidates might be capable of producing. The number of analysts providing the estimates is listed at the bottom of the graph and I suggest the reader take note of the Analyst Scorecard results listed at the bottom of the FAST FACTS table to the right of each graph.
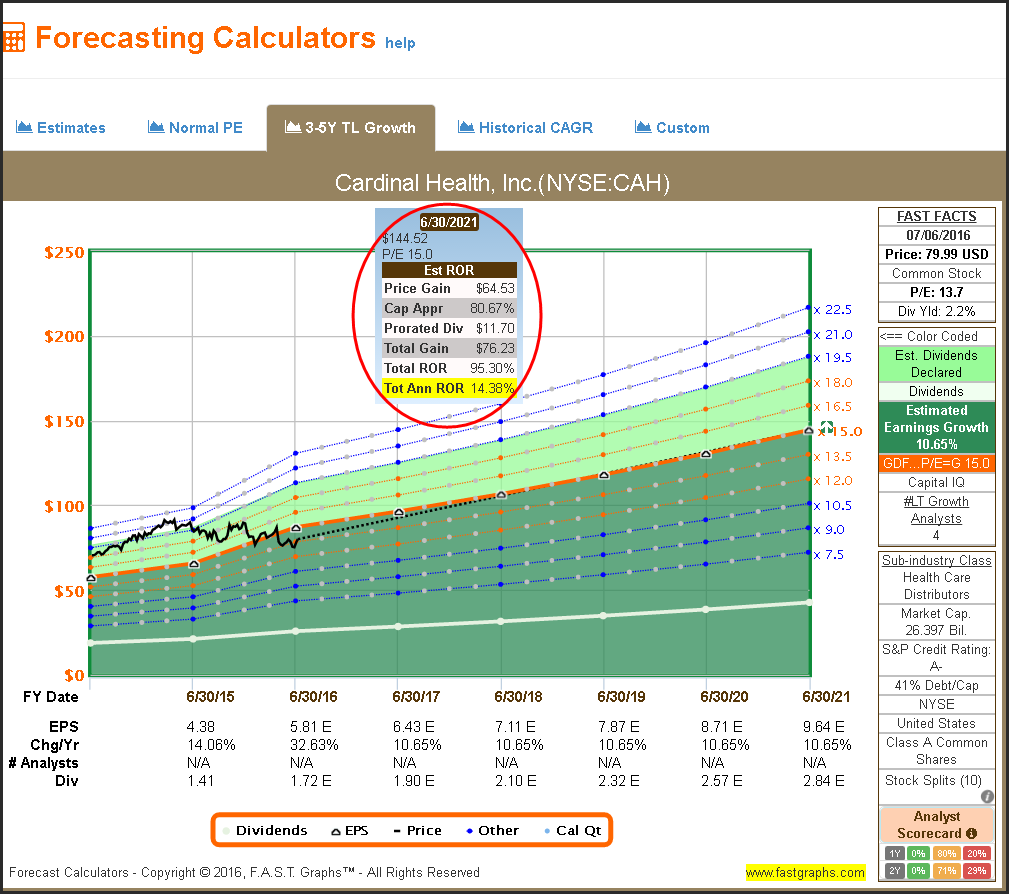
The second Forecasting Calculator is based on an additional set of long-term trend line estimates provided by S&P Capital IQ. Although I consider the near-term estimates on the first calculator more relevant, there is some value in running a longer-term “what-if” scenario. However, note that the number of analysts providing these estimates is listed in the FAST FACTS table and that this long-term trend line estimate is typically made up of fewer analysts reporting.
The real value in running these types of “what if” scenarios is not in determining a precise rate of return potential on each of these companies. Instead, the value of these exercises is to provide a perspective of what the opportunities might be if the companies performed as expected on both an operating basis and a price action basis. The point is to have a rational expectation of what you might be able to earn from investing in these companies rather than simply investing with the hope you might make some money. To the dividend growth investor, the dividend may be more important than the price appreciation potential.
Aflac Incorporated
AbbVie Incorporated
Target Corp
Pentair plc
Cardinal Health Inc
AT&T Inc
T Rowe Price Group Inc
Summary and Conclusions
What I have presented with this article is simply a listing of the only Dividend Aristocrats that I consider reasonably valued in today’s market environment. There are a couple of takeaways that I hope the reader gets from this presentation. First and foremost, is the realization that sound valuation is hard to come by today. This is especially true when considering best-of-breed high-quality blue-chip dividend growth stocks for your portfolios.
Additionally, I am not suggesting that the seven research candidates are where you should put your dividend growth dollars today. I recently published an article titled Get Higher Returns and More Dividend Income-In Less Time with Less Risk where I presented the argument that waiting for a better valuation could be a good idea. Therefore, if none of these fairly valued Dividend Aristocrats suits your needs, you might be wise sitting things out for a while. However, don’t wait too long, because in the long run, time in the investment is better than timing the investment.
Said differently, when you do find good value, do not be afraid to lay your money down for fear of a correction. It’s important to consider that there is a significant difference between when a stock falls from being overvalued compared to when a stock falls when it is fairly valued or undervalued. I contend that a stock will eventually and even inevitably return to fair value.
However, after a stock has fallen from being overvalued, it is not prudent to believe it will become overvalued again. It might, and it might not, because there is no rational reason for overvaluation in the first place. In contrast, fair and sound valuation based on fundamentals is rational, which is why I believe it is inevitable in the longer run. Therefore, it’s important to never forget that you make your money on the buy side.
Disclosure: Long T,ABBV,AFL,TGT
Disclaimer: The opinions in this document are for informational and educational purposes only and should not be construed as a recommendation to buy or sell the stocks mentioned or to solicit transactions or clients. Past performance of the companies discussed may not continue and the companies may not achieve the earnings growth as predicted. The information in this document is believed to be accurate, but under no circumstances should a person act upon the information contained within. We do not recommend that anyone act upon any investment information without first consulting an investment advisor as to the suitability of such investments for his specific situation.
