The most important issue facing the US markets and economy is the pending government shutdown. If this expands into a debt default, the implications reach worldwide. As I accurately forecast last week:
"Despite a busy economic calendar this week will focus on Washington and the inability to compromise on important decisions. There are two key questions:
- Can a government shutdown be avoided?
- Will the U.S. default on its debt, by failing to raise the debt ceiling?"
The background and discussion still reads well, so I urge readers to check that out as a refresher.
An Important Distinction about Politics
Regular readers know that I strongly recommend separating your political viewpoints from your investing. You should join me in being politically agnostic—willing to invest successfully no matter who is in power.
It is fine to have an opinion about ObamaCare, about debt, about European leadership, or about the Fed. Feel free to express your viewpoints in personal discussions or in the ballot box. Stop there. Confusing what you hope will happen with what probably will happen is the fast track to investment losses!
When I discuss policy issues, I am helping you to predict what will probably happen and also the investment consequences. I have been extremely accurate on every important policy decision for many years – Europe, 2011 debt ceiling, fiscal cliff, etc. – often in disagreement with the majority of pundits. I have never expressed personal preferences, but instead emphasize how to profit from likely outcomes. I regularly cite sources covering a wide political spectrum. Discerning readers might note that I find the viewpoints of extremists of all types to be market-unfriendly. Mainstream thought, from whichever party, is better for investments, whatever your personal views.
The implication for investors is that gridlock leading to a default on U.S. debt is bad. This is an investment conclusion, not a vote on ObamaCare.
Current Situation
At the time I am writing this, a government shutdown seems to be unavoidable. Some key points:
- Polls show that both parties will be blamed for a shutdown. This encourages brinksmanship.
- Obama has little incentive to negotiate. See Ezra Klein's analysis of the "Putin" argument.
- The GOP is ready to rumble! Veteran Hill observer Stan Collender writes that their "lesson" from the Clinton-era shutdown is that they were not aggressive enough.
What does this mean for investors?
- A shutdown might cut GDP by as much as 1.4%.
- Here are some specific effects.
The two themes – the shutdown and the debt ceiling -- have become linked. Originally Speaker Boehner wanted to avoid a potential shutdown, preferring to use the debt ceiling as leverage. Under pressure from the Tea Party wing of the party, the House passed a continuing resolution that eliminated funding for ObamaCare. The Senate stripped the ObamaCare portions from the bill and sent it back. The House (at least at the time of writing) is standing firm and the Senate is in recess until Monday afternoon. There is no chance for agreement on the House bill.
What will this mean for stocks? I have some thoughts which I'll report in the conclusion. First, let us do our regular update of last week's news and data.
Background on "Weighing the Week Ahead"
There are many good lists of upcoming events. One source I regularly follow is the weekly calendar from Investing.com. For best results you need to select the date range from the calendar displayed on the site. You will be rewarded with a comprehensive list of data and events from all over the world. It takes a little practice, but it is worth it.
In contrast, I highlight a smaller group of events, including some you have not seen elsewhere. My theme is an expert guess about what we will be watching on TV and reading in the mainstream media. It is a focus on what I think is important for my trading and client portfolios. Each week I consider the upcoming calendar and the current market, predicting the main theme we should expect. This step is an important part of my trading preparation and planning. It takes more hours than you can imagine.
My record is pretty good. If you review the list of titles it looks like a history of market concerns. Wrong! The thing to note is that I highlighted each topic the week before it grabbed the attention. I find it useful to reflect on the key theme for the week ahead, and I hope you will as well.
This is unlike my other articles where I develop a focused, logical argument with supporting data on a single theme. Here I am simply sharing my conclusions. Sometimes these are topics that I have already written about, and others are on my agenda. I am putting the news in context.
Readers often disagree with my conclusions. Do not be bashful. Join in and comment about what we should expect in the days ahead. This weekly piece emphasizes my opinions about what is really important and how to put the news in context. I have had great success with my approach, but feel free to disagree. That is what makes a market!
Last Week's Data
Each week I break down events into good and bad. Often there is "ugly" and on rare occasion something really good. My working definition of "good" has two components:
- The news is market-friendly. Our personal policy preferences are not relevant for this test. And especially -- no politics.
- It is better than expectations.
The Good
Despite the stock market reaction, this was a pretty good week for economic data.
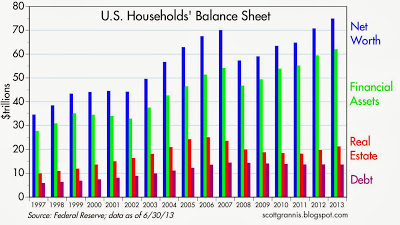
- Household wealth has improved dramatically. Scott Grannis writes as follows (but see the inequality link in "The Bad"):
"…(H)ousehold net worth now stands at $74.8 trillion, up some $4.5 trillion from the previous (March '13) estimate, and up $18.4 trillion from the recession low. Virtually every metric of households' financial health has shown significant improvement over the past several years. Owner's equity in household real estate has surged 50% since 2009; net worth and financial assets are up 35% from their March 2009 low; the value of households' real estate holdings is up 17% in just the past two years; owner's equity as a percent of household real estate has jumped to almost 50%, up from its all-time low of 37% four years ago; household debt has declined by almost $1 trillion from its 2008 high, and is now back to the levels of early 2007."
Net worth at a new high, financial assets at a new high, real estate values recovering, debt declining: what's not to like?
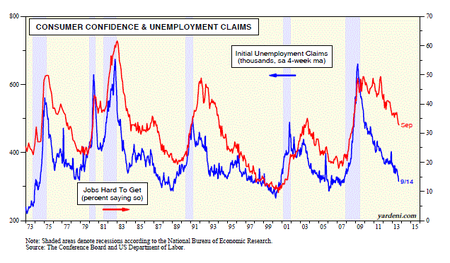
Jobless claims remained low, confirming the recent data points. Jobs are easier to get. Dr. Ed Yardeni looks inside consumer confidence data and jobless claims. See his discussion of what this means for unemployment.
- The Chinese flash PMI rose to 51.2, a six-month high. The "official" report is usually stronger.
- Personal income and spending edged higher than expectations. Doug Short provides a helpful chart update, as well as his "Big Four" noted below.
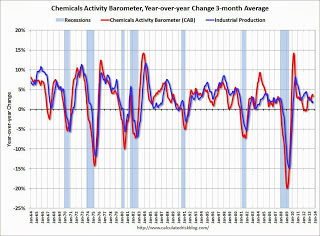
- The chemical activity barometer suggests an upside surprise. Calculated Risk analyzes this "new" indicator, which seems to lead industrial production
- Durable goods orders rose slightly and beat expectations of a decline on the headline number. Steven Hansen is not convinced. See his analysis with the variety of comparisons we all expect from GEI.
- Jobless claims remained low, confirming the recent data points. Jobs are easier to get. Dr. Ed Yardeni looks inside consumer confidence data and jobless claims. undefined of what this means for unemployment.
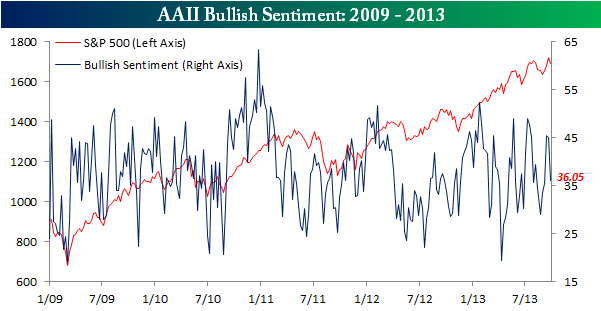
- Bullish investor sentiment from the AAII declines – good news as a contrarian indicator. Here is the updated chart from Bespoke.
The Bad
As always, there was a little bad news. Feel free to add in the comments anything you think I missed!
- Inflation remains too low. Economist Justin Wolfers notes this interesting aspect of the final revision of Q2 GDP, otherwise a snoozer. The implication is important for those who really want to understand Fed policy instead of stating their own opinions. Here is a key quote:
"The deeper problem is that the Fed's target is widely perceived to be asymmetrical. Imagine the response among policy makers if headline inflation were running at 4 percent, and core inflation were at 3 percent. In the colorful words of Chicago Fed President Charlie Evans, they "would be acting as if their hair was on fire." We're experiencing the mirror image – an equivalent undershooting of the inflation target, but without an equivalent policy response.
With inflation continuing to undershoot the Fed's inflation target, and millions remaining needlessly unemployed, policy makers need to start acting as if their hair were on fire." - Housing data presented a mixed picture. This is a key component of the recovery and is very complicated. There are many issues and measures, and plenty of room for interpretation in the results. Steven Hansen notes the weakening in pending home sales with plenty of charts and comparisons. Calculated Risk comments more on new home sales, concluding, "The housing recovery has slowed, but it is ongoing - and I expect the recovery to continue for some time."
- Consumer confidence continues to disappoint on both the Conference Board and Michigan measures. I regard these as good concurrent indicators for employment and spending. (More from Doug Short, including an update of the chart I cite so often).
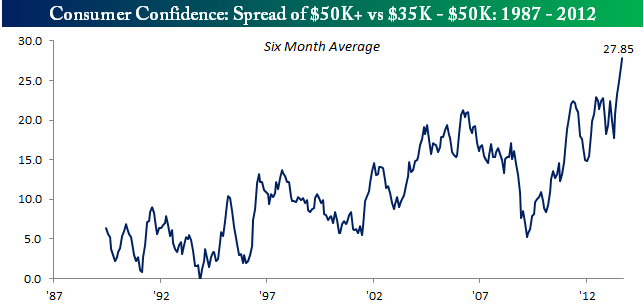
- The confidence gap grows. Bespoke tracks an interesting breakdown in consumer confidence -- those with incomes of $35K versus $50K. It is an interesting analysis leading to this key chart:
The Ugly
Congress is winning the "ugly" award so often that we might have to retire the original trophy!
The Indicator Snapshot
It is important to keep the current news in perspective. I am always searching for the best indicators for our weekly snapshot. I make changes when the evidence warrants. At the moment, my weekly snapshot includes these important summary indicators:
- For financial risk, theSt. Louis Financial Stress Index.
- An updated analysis of recession probability from key sources.
- For market trends, the key measures from our "Felix" ETF model.
Financial Risk
The SLFSI reports with a one-week lag. This means that the reported values do not include last week's market action. The SLFSI has recently edged a bit higher, reflecting increased market volatility. It remains at historically low levels, well out of the trigger range of my pre-determined risk alarm. This is an excellent tool for managing risk objectively, and it has suggested the need for more caution. Before implementing this indicator our team did extensive research, discovering a "warning range" that deserves respect. We identified a reading of 1.1 or higher as a place to consider reducing positions.
The SLFSI is not a market-timing tool, since it does not attempt to predict how people will interpret events. It uses data, mostly from credit markets, to reach an objective risk assessment. The biggest profits come from going all-in when risk is high on this indicator, but so do the biggest losses.
Recession Odds
I feature the C-Score, a weekly interpretation of the best recession indicator I found, Bob Dieli's "aggregate spread." I have now added a series of videos, where Dr. Dieli explains the rationale for his indicator and how it applied in each recession since the 50's. I have organized this so that you can pick a particular recession and see the discussion for that case. Those who are skeptics about the method should start by reviewing the video for that recession. Anyone who spends some time with this will learn a great deal about the history of recessions from a veteran observer.
I also feature RecessionAlert, which combines a variety of different methods, including the ECRI, in developing a Super Index. They offer a free sample report. Anyone following them over the last year would have had useful and profitable guidance on the economy. RecessionAlert has developed a comprehensive package of economic forecasting and market indicators, including this recent update on the world economy.
Georg Vrba's four-input recession indicator is also benign. "Based on the historic patterns of the unemployment rate indicators prior to recessions one can reasonably conclude that the U.S. economy is not likely to go into recession anytime soon." Georg has other excellent indicators for stocks, bonds, and precious metals at iMarketSignals. For those interested in gold, he has a recent update, asking when there will be a fresh buy signal.
Unfortunately, and despite the inaccuracy of their forecast, the mainstream media features the ECRI. Doug Short has excellent continuing coverage of the ECRI recession prediction, now two years old. Doug updates all of the official indicators used by the NBER and also has a helpful list of articles about recession forecasting. Doug also continues to refresh the best chart update of the major indicators used by the NBER in recession dating.
The average investor who mistakenly focuses on these headlines has missed – and continues to miss – a major move, as we note in this week's investor insights.
Readers might also want to review my Recession Resource Page, which explains many of the concepts people get wrong. 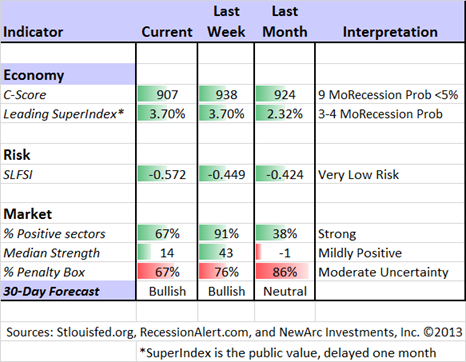
Our "Felix" model is the basis for our "official" vote in the weekly Ticker Sense Blogger Sentiment Poll. We have a long public record for these positions. Three weeks ago Felix turned bearish. I wrote, "Felix might switch to a neutral posture if the overall market holds its ground." With the reduced chance of military action against Syria, the market celebrated the reduction in uncertainty. Last week marked a dramatic shift in the ratings, which remain slightly in bullish territory.
Felix does not react to news events, and certainly does not anticipate effects from the headlines. This is usually a sound idea, helping the trading program to stay on the right side of major market moves. Abrupt changes in market direction will send sectors to the penalty box. The Ticker Sense poll asks for a one-month forecast. Felix has a three-week horizon, which is pretty close. We run the model daily, and adjust our outlook as needed.
The penalty box percentage decreased again this week. A high rating means that most ETFs are in the penalty box, so we have less confidence in the overall ratings. That measure remains elevated, but it is improving.
[For more on the penalty box see this article. For more on the system ratings, you can write to etf at newarc dot com for our free report package or to be added to the (free) weekly ETF email list. You can also write personally to me with questions or comments, and I'll do my best to answer.]
The Week Ahead
This week's schedule might be affected by a government shutdown. Private data from sources like the ISM and ADP will be announced as usual. Government data depends both on significance and whether the reports are mostly assembled already. This means that there is some risk of disclosure during a delay. The BLS may go ahead with jobless claims and the employment report, arguing that these are "principal federal economic indicators." There is some precedent for allowing a small team to release reports that are mostly complete. The Commerce department has no plans to release data during a shutdown. This affects most other reports. If the shutdown lasts longer than a week, we probably will also lose upcoming employment data. (See this good WSJ article for more).
The "A List" includes the following:
- Employment report (F). Despite the noise in the series and the many revisions, this remains the most important single indicator both for government policy and the markets.
- Initial jobless claims (Th). This is the most frequent and responsive employment indicator, but it tells only part of the story.
- ISM Index (T). An important concurrent economic indicator with some leading components.
- ADP employment (W). This measure of private employment is always judged as a predictor of the "official" report, but it actually contains important independent data via a different approach.
The "B List" includes the following:
- ISM Services index (Th). The service sector is bigger than manufacturing, but the latter index gets more attention.
- Light vehicle sales (T). More widely followed recently as a part of the economic rebound.
- Construction spending (T). August data, but important because of the role of construction.
- Chicago PMI (M). Mostly important as a sneak peek for the national ISM data.
We'll get some FedSpeak, principally Chairman Bernanke on Wednesday. Whatever the topic, questioners will try to draw him into a discussion of current policy and the Fed Chair succession. ECB Chief Draghi will announce the interest rate decision of their governing council on Wednesday.
And of course, we'll have non-stop finger pointing and punditry with a countdown clock in the background.
How to Use the Weekly Data Updates
In the WTWA series I try to share what I am thinking as I prepare for the coming week. I write each post as if I were speaking directly to one of my clients. Each client is different, so I have five different programs ranging from very conservative bond ladders to very aggressive trading programs. It is not a "one size fits all" approach.
To get the maximum benefit from my updates you need to have a self-assessment of your objectives. Are you most interested in preserving wealth? Or like most of us, do you still need to create wealth? How much risk is right for your temperament and circumstances?
My weekly insights often suggest a different course of action depending upon your objectives and time frames. They also accurately describe what I am doing in the programs I manage.
Insight for Traders
Felix has continued a bullish posture, fully reflected in trading accounts. The emphasis has been on foreign ETFs, although the broad market ETFs have positive ratings. Felix's ratings have been in a fairly narrow range for several months. The rapid news-driven shifts are not the ideal conditions for Felix's three-week horizon. The high penalty box rating continues to underscore the uncertainty.
Insight for Investors
The challenge for investors is to distinguish between the major trends and the short-term uncertainty. The main themes are not related to headlines news, even though sentiment may drive market fluctuations. Do not be seduced by the idea that you can time the market, calling every 10% correction. Many claim this ability, but few have a documented record to prove it. Most who claim past success are using a back-tested model. Please see The Seduction of Market Timing.
This past week I wrote further on how investors can manage risk, specifically considering the role of bonds and the risk of bond mutual funds. As I emphasized, "You need to choose the right level of risk!" Right now, it is the most important question for investors. There is plenty of "headline risk" that may not really translate into prospects for stocks.
Last week I highlighted a great piece from Josh Brown. In case you missed it or did not click through to the link, it is still very relevant. Josh writes about one of the major mistakes of the individual investor – "all-in or all-out" market timing. He has a great list of 20 reasons for going to cash. You have to read the entire post, but my favorites are the Hindenburg Omen (of course), Portuguese bond auctions, Marc Faber, and HFT. Find your own favorites and add more in the comments, as Josh invites.
This week Scott Grannis underscores the error of undue focus on headlines rather than data. He writes as follows:
"Pessimism has its place, and there is no shortage of things that could be improved. To name just a few: the federal deficit is still relatively large; the unemployment rate is still relatively high; the labor force participation rate is miserably low; owner's equity should be at least 60% of real estate holdings; regulatory burdens are a huge, deadweight burden on almost everyone; entitlement spending is on an unsustainable path; and Obamacare promises to self-destruct.
Yes, there are many things wrong out there, but at the same time there has been a whole lot of improvement. Those who have viewed the glass as half empty, and who have thus avoided taking on risk, have passed up tens of trillions of dollars of gains. Those optimists who have viewed the glass as half full have been richly rewarded. If things continue to improve, and if we can simply avoid a recession, there are more gains to be had by taking on risk and avoiding cash."
This explains why I emphasize recession forecasting – and data -- in these weekly posts.
Here are the key concepts for investors:
- Beware of yield plays. For several months, I have accurately emphasized the danger of yield-based investments – yesterday's source of safety. The popular name for this is "The Great Rotation." It is still in the early innings, since bond fund investors are only getting the bad news from their statements. Even the best bond managers (like Gross and Gundlach) cannot win when interest rates are rising. PIMCO has lost 14% of its assets (through redemptions and losses).
- Find a safer source of yield: Take what the market is giving you!
For the conservative investor, you can buy stocks with a reasonable yield, attractive valuation, and a strong balance sheet. You can then sell near-term calls against your position and target returns close to 10%. The risk is far lower than for a general stock portfolio. This strategy has worked well for over two years and continues to do so. (I freely share how we do it and you can try it yourself. Follow here). - Lose the focus on fear! Many are rewarded for making sure that you are "scared witless" (TM OldProf euphemism). If you are addicted to gold and allegedly safe yield stocks, you need a checkup. Gold works in times of hyperinflation or deflation/crisis. When neither happens, the ball is going between these Golden Goalposts. There is a good transition plan for those with a fixation and fear and gold.
And finally, we have collected some of our recent recommendations in a new investor resource page -- a starting point for the long-term investor. (Comments and suggestions welcome. I am trying to be helpful and I love feedback).
Final Thought
When the crystal ball is cloudy, it is wise to have a flexible plan.
If the circumstances improve, it will be similar to the fiscal cliff issue at the start of this year. When the widely-predicted disaster was averted, there was a quick pop in stocks of 7% after which pundits said that we should all wait for a correction. It is challenging to time the market based upon these news events.
Here is my current working hypothesis:
- The shutdown will occur, with most scoffing at the effects;
- Complaints will start to build;
- Regardless of who wins the blame game, a continuing resolution will be passed;
- The timing may stretch into the anticipation of a default on debt;
- Consumers, foreigners, and markets may lose confidence if the debt ceiling deadline is approached; (See the FT's Take)
- There is little incentive for politicians to resolve this issue early, and some incentive (posturing for constituent groups) to wait until the last minute;
- The government shutdown may actually encourage an earlier resolution to the debt ceiling issue; (See Ezra Klein's take)
- Investors have seen the story before, and might not react as violently; and finally
- The U.S. will not default on its debt. This mainly rests on the understanding of the consequences by business leaders, who will lean on mainstream Republicans if the issue gets close. See this summary.
There are many points in this chain, and each one is open to debate. I emphasize the importance of understanding the limits of forecasts, so we must all realize that this is a fluid situation.
I am monitoring events closely through a variety of sources, including many that I regularly cite, but which are not often monitored by most investment pundits. You should be, too! My guess is that we will be revisiting many of these same topics next week.
