Highlights
- Market Movers: Weekly Technical Outlook
- Was Friday’s NFP a “Goldilocks” report for oversold US equities?
- Look Ahead: Stocks
- Look Ahead: Commodities
- Global Data Highlights
Technical Developments:
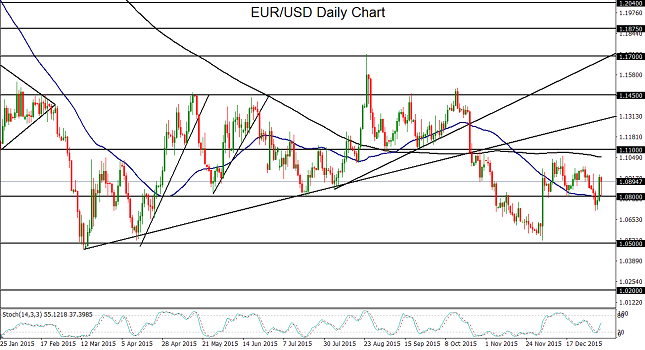
- EUR/USD has struggled to find direction with the heightened global volatility of the past week but should remain bearish on any re-break below 1.0800 support. Technical bias: Neutral to Moderately Bearish
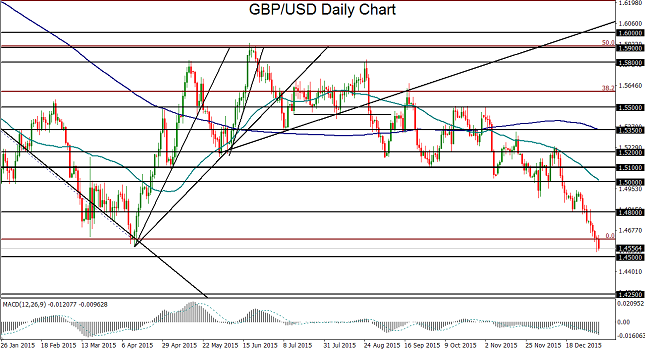
- GBP/USD has continued to follow-through on its sharply bearish momentum, recently hitting a new multi-year low. Technical bias: Bearish
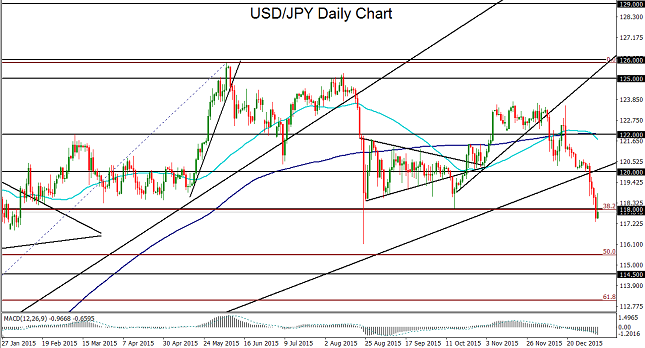
- USD/JPY has plunged on yen safe haven flows in the midst of turmoil in the global equity markets, and could fall further if China’s financial/economic woes continue to weigh on the markets. Technical bias: Moderately Bearish
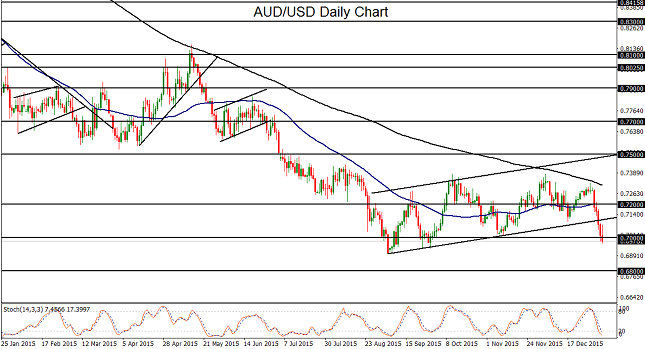
- AUD/USD has tentatively dropped below 0.7000 as problems in Chinese markets have pressured the China-linked Australian dollar. Technical bias: Bearish
EUR/USD
This past week, the first trading week of the New Year, saw some whipsaw volatility for EUR/USD as it struggled to find a sustained direction. The beginning of the week was moderately bearish, as the euro fell on lower-than-expected inflation data from euro area countries and the dollar experienced a surge in the very beginning of the year. This caused a tentative breakdown below key 1.0800 support. The drop reversed course back above 1.0800 by mid-week, however, as the dollar pulled back due to concerns that low inflation and the global economy, especially in China, might prompt the Fed to postpone a second rate hike. Friday’s NonFarm Payrolls report, which far exceeded expectations at 292,000 jobs added against prior expectations of 203,000, caused an initial surge in the dollar once again, as it provided some additional impetus for a sooner rate hike. Despite these fluctuations throughout this past week, the longer-term directional bias for EUR/USD remains bearish in light of continuing divergent monetary policy between the Fed and ECB, as well as the clear long-term downtrend for the currency pair. If EUR/USD manages to re-break below the key 1.0800 level and 50-day moving average, the next major downside target remains around the 1.0500 support level, which was last approached in early December.
Source: FOREX.com
GBP/USD
This past week has clearly been bearish for GBP/USD, which has essentially remained in freefall from mid-December. Despite the midweek pull back for the US dollar, GBP/USD mostly persisted in a staunchly bearish stance as the pound continued to founder on the Bank of England’s (BoE) indeterminate monetary tightening timeline. With the Fed having already begun raising rates in December and presumably on track for more hike(s) this year, and the BoE still uncertain as to its own monetary tightening cycle, further losses could potentially be in store for GBP/USD. The better-than-expected US Non-Farm Payrolls data on Friday contributed to even further downside momentum for the currency pair, as the dollar strengthened due to expectations that solid employment should encourage a more hawkish Fed. Next week brings the BoE’s Monetary Policy Summary, which should provide further clues as to how close (or not) the BoE may be to raising interest rates in the UK. Currently, GBP/USD has tentatively broken down below its major support target around the key 1.4600 level, which is roughly where the currency pair bottomed out last April. In the process, it has established a new 5½-year low. On any sustained trading below 1.4600, GBP/USD could continue its downside momentum towards further multi-year lows, with the next major downside targets at the 1.4500 level followed by the key 1.4250 support area.
Source: FOREX.com
USD/JPY
With the exception of Friday, the past week has been intensely bearish for USD/JPY. This occurred as a flight to the Japanese yen safe haven ensued after turmoil in the global equity markets was sparked by China’s financial and economic woes. On Friday morning, however, a slight measure of stability initially returned to stock markets in China, Europe, and the US, and the US dollar regained a bit of traction on a highly positive NFP report. This prompted an initial rebound for USD/JPY. Prior to this rebound, stock market volatility had pushed USD/JPY below key support around the 118.00 level. Despite this tentative stabilization, however, China’s economy and financial markets remain highly vulnerable. In the event of further equity market volatility in China that continues to spill over into other major financial markets, another flight to the yen could very well ensue. With any sustained trading below the noted 118.00 level, the next major downside target is at the 116.00 support level, last hit one year ago at the beginning of 2015.
Source: FOREX.com
AUD/USD
The first trading week of the New Year has seen nothing but pressure for AUD/USD. An exceptionally sharp slide occurred this week as China’s financial and economic troubles weighed heavily on the China-linked Australian dollar. This pressure has culminated in the currency pair breaking down below an important uptrend support line extending back to September’s 6-year low around 0.6900, and hitting major psychological support at the 0.7000 level. Having currently broken down below this 0.7000 level after positive US jobs data propped up the US dollar and continued worries over China weighed on the Australian dollar, AUD/USD could have significantly further to fall. Under the noted 0.7000 psychological support level, the next major support target is at the key 0.6800 level, which would confirm a continuation of the sharp and longstanding bearish trend.
Source: FOREX.com
Was Friday’s NFP a “Goldilocks” report for oversold US equities?
Hopes were high heading into today’s US jobs report, and at least on a headline basis, the report did not disappoint.
Traders were looking for another reading slightly above 200k, which would be essentially in line with the 12-month average heading into today’s release (~220k), but as it turns out, the US economy actually created an eye-catching 292k jobs in the month of December. The cherry on top of December’s strong job growth was a +50k revision to the previous two months’ reports, which made the apparent Q4 slowdown in the labor market look far more like noise than a signal of a sputtering economy. While the unemployment rate was unchanged at 5.0%, we saw the labor force participation rate (LFPR) tick up to 62.6%, suggesting that, at the margin, some discouraged workers felt confident enough to start looking for jobs again, a strong long-term sign for the US labor market.
That said, it wasn’t all sunshine and butterflies for bulls on the US economy. Specifically, the average hourly earnings (AHE) measure, which measures the monthly change in wages for US employees, came out flat (0.0%) m/m vs. an expected gain of 0.2% m/m. This reading brought the year-over-year reading to 2.5%, which is firmly above the inflation rate, but not as strong as the 2.7% rate anticipated by traders and economists.
As Wednesday’s Fed minutes reminded us, some central bankers wanted to see actual signs of inflation before raising interest rates more aggressively, and the not-as-strong-as-anticipated increase in wages could keep those policymakers skeptical. Of course, there are still two more jobs reports (as well as plenty of data on inflation, GDP growth, retail sales, etc) before the Fed’s next “major” meeting in mid-March, so there will be plenty more to chew over before the US central bank has to make its next big decision.
Market Reaction
As is often the case with the notoriously fickle non-farm payrolls report, the initial moves we saw across global markets have started to reverse as we go to press. We initially saw a bout of dollar strength, with EUR/USD dropping to 1.0800 and USD/JPY spiking to 118.80, but those moves have since faded as traders digest the implications of mediocre wage growth and the dollar is actually trading below its pre-NFP levels against those two rivals. Likewise, the kneejerk bearish reaction in gold has done a 180° and the yellow metal is now trading back above the key 1100 level.
Of all the major markets, today’s jobs data could serve as a potential “goldilocks” report for deeply oversold US equities. That’s because the strong quantity of jobs indicates a generally solid economy with more money in consumers’ pockets, but the lack of wage increases has two benefits for big companies: obviously it suggests that salary expenses remain low relative to historical norms, increasing bottom line profits, but it also could keep the Fed in wait-and-see mode, keeping down interest expenses and reducing the attractiveness of bonds, which directly compete with equities for capital.
Of course, we don’t want to read too much into just one month’s jobs data, but as we move through today and into next week, desperate bulls could latch onto today’s NFP report as an excuse for an oversold bounce in beleaguered US stock markets.
Look Ahead: Stocks
What a horrible, horrible week it has been for the global stock markets. Equities had their worst ever start to a year in the US, while in Europe it was the worst start since at least the 1970s according to Goldman Sachs. In China, the circuit breaker was triggered twice this week after huge drops there. Many market participants thought the newly introduced tool exacerbated the sell-off and so Chinese authorities decided to abort it altogether. The People’s Bank of China also fixed the USD/CNY lower on Friday. These measures, as well as short-covering ahead of Friday’s US jobs report and the weekend helped to stabilize the stock markets in China, leading to a sharp rebound in Europe at the end of an awful week. However, once trading got under way in the US, the global indices started to head lower again and were trading near their lows when this report was written. Investors were evidently not too impressed with the fact wage growth in the US remained flat in a month that saw private sector jobs rise by a solid 292,000, which was much higher than expected.
So, as we head into the weekend, there’s still no end in sight for the equity market sell-off. But this could change any minute of course. Traders will need to be alert to the possibility of an unexpected rebound, especially since the markets are looking severely oversold in the short term. Added to this, the latest economic data has not been too bad when you take the Chinese manufacturing PMI out of the equation. As well as economic data, stocks may find support from the upcoming US earnings season which unofficially kicks off next week. So, there may be light at the end of the tunnel for the equity markets.
From a technical point of view, the S&P 500 and European stock indices have reached or neared significant support levels. Given the extent of the recent drop, we think that a modest bounce at these levels is likely at the very least. The sellers may book profit, while the frustrated bulls may decide it is time to step in again. In theory, the combination of short-covering and possibly some opportunistic buying pressure could provide support to the markets early next week. However, so far there’s little evidence to suggest the buyers have stepped back in or are ready to do so any time soon. Thus, bullish speculators may wish to wait for some sort of confirmation before concluding that the selling pressure has ended.
But the S&P 500 has reached the important 61.8% Fibonacci retracement level of the bounce from the August 2015 low around 1942. Given that there is also a 161.8% extension level converging around here, at 1938, we have a potential Bullish Gartley pattern in the making. Meanwhile, the RSI has almost reached the 'oversold' threshold of 30, which suggests that the bearish momentum may be about to peak.
If the S&P does bounce back from here as the abovementioned technical signals suggest, then a rally to previous support at 1980 or even the key 1994-2000 area would become highly likely in early next week. What happens next will depend on price action there as well as sentiment at the time. In any event, bullish traders may wish to wait for some sort of confirmation here before jumping on the bandwagon, because there is a risk for a much bigger move lower. Indeed, if the sellers refuse to ease pressure and the index moves below the 1938-42 Fibonacci-based support range then fresh selling could emerge, leading to a possible move towards the next Fibonacci or other support levels shown on the chart. The August low at 1834 would then become a realistic bearish target, too. It is also possible that in the case of a rebound from the aforementioned support at 1938-42, the index could run into renewed pressure once it arrives at important resistances shown on the chart. So, one should proceed with extreme caution.
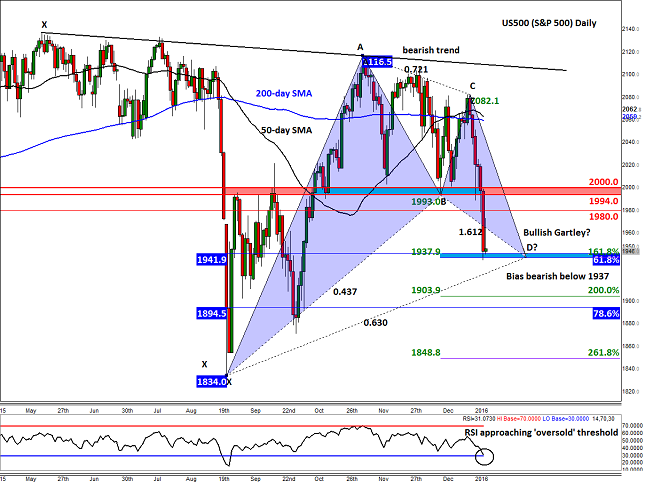
Source: FOREX.com. Please note this product is not available to US clients.
Look Ahead: Commodities
While crude oil prices dropped to fresh multi-year lows this week, gold rallied to a new nine-week high of $1112 in early trading on Friday before dropping by a good $15 to trade back below $1100 ahead of the US jobs report later on in the day. The People’s Bank of China fixed the USD/CNY lower a day after the Chinese authorities decided to abort the circuit breaker after it was triggered twice this week following the big drops in Chinese stocks. This, as well as short-covering ahead of Friday’s US jobs report and the weekend, helped stabilize the stock markets (see above for details). So, gold’s intraday drop on Friday was due to the slightly positive tone in the stock markets, which reduced the appeal of safe haven assets such as gold. But in the second half of the day, gold managed to bounce back a touch as equities and the dollar both sold off despite a strong US jobs report.
Given the current market environment, we think that the volatility of the stock markets will be more important for gold than the dollar. Friday's close on Wall Street will therefore be very important for equities, and by extension gold. A strong positive close there will bode well for stocks in early next week; else we should expect more of the same next week. But concerns about China could increase further by Tuesday because that’s when the latest trade figures from the world’s second largest economy are released. So, the precious metal may be able to further extend its gains in the near term should risk aversion increase, or at the very least maintain a bullish bias which could discourage fresh selling.
From a technical perspective, gold’s break above the high of the recent consolidation range around $1080 is bullish. Although it has already moved above the next key resistance area between $1098 and $1104, the precious metal pulled back Friday to trade below this range. Thus, there is a risk that the downward trend could resume as early as next week, especially if global equities and the dollar manage to rebound in the aftermath of a stronger US jobs report. A failure here could see the metal head back towards the previous resistances such as $1080 and what it does next will depend on the bulls’ willingness – or lack thereof – to defend that level. A decisive break below $1080 would be bearish.
On the contrary, if the buyers decide to show up and support gold around these levels then this may pave the way for a move towards the 61.8% Fibonacci retracement level of the most recent downswing at $1136. It is also possible for gold to even rally towards the 200-day moving average, currently at just shy of $1140, or even the 78.6% retracement at $1160. The latter also ties in with a long-term bearish trend line, making it a significant resistance area should we get there.

Source: FOREX.com. Please note this product is not available to US clients
Global Data Highlights
Monday, January 11
No major economic data releases scheduled.
Tuesday, January 12
9:30 GMT – UK Manufacturing Production
Manufacturing tends to be a leading indicator for economic health, and the indication has not been great out of the UK of late. Activity oscillated between +1% m/m and -1% m/m throughout all of 2015, so another print in that range is expected this month, but there’s a chance it could come in weak after the poor Manufacturing PMI report. The Bank of England wants to see strong, sustained growth in Manufacturing to feel comfortable raising interest rates later this year.
Wednesday, January 13
TBD – Chinese Trade Balance (December)
China has been in the news for all the wrong reasons at the start of 2016, but the economic data has been as horrible as the stock market performance (and the news headlines) would have you believe. That means traders are either overreacting to slightly negative data (a definite possibility) or that things are about to get a lot worse in the Middle Kingdom. This trade balance report could help tilt the scales one way or another and could have a big impact on the current jittery global market sentiment.
Thursday, January 14
0:30 GMT – AU Employment report
Traders have had a tough time getting a bead on Australia’s labor market over the last few quarters. The island nation recently recalibrated how it calculates its monthly job figures, and the data has been prone to massive outliers since then. To wit, the last two reports have printed shown an average of over 60k jobs created per month, a staggering figure for a country with a population of 23 million people. Some giveback this month wouldn’t be surprising, but many traders have lost confidence in the indicator as a credible, actionable report, so any reaction may be limited.
12:00 GMT – BOE Super Thursday
The venerable UK central bank meets this coming Thursday, and as usual, no change to monetary policy is anticipated. Nonetheless, traders will closely scrutinize the votes for and against the committee’s statement for signs of a potential future rate hike. The accompanying statement should also help shape monetary policy expectations heading into a crucial year for the BOE.
Friday, January 15
13:30 GMT – US Retail Sales
December is the most important time of the year for many US retailers, so this report will show how willing the US consumer was to open his wallet over the critical holiday shopping period. Recent retail sales data has been tepid at best, with the last three months’ reports showing negligible growth, despite otherwise decent economic data. Traders and economists are expecting at 0.2% m/m increase on a headline basis, with a 0.4% m/m gain in the core retail sales figure.
13:30 GMT – US PPI
While not as widely watched as its consumer counterpart, the producer price index (PPI) can give a leading indication of potential inflation heading down the pipeline. This figure did rise at a 0.3% last month, but the prior three months actually showed a drop in price pressures for US producers. This report is unlikely to have a major market-moving impact, but could provide insight about to expect from the more important CPI report moving forward.
15:00 GMT – US Preliminary U. of M. Consumer Sentiment
When it comes to economic reports, this is about as timely as they get: this report shares the results of surveys taken in the current month and is one of the best on-the-ground measures of consumer confidence. Traders will watch the interplay between falling gas prices (positive) and the recent market turmoil (negative) to see if consumers will continue to stimulate the economy.
