Market Movers: Weekly Technical Outlook
Technical Developments to Watch:
- EUR/USD precariously poised at 1.1400 ahead of Greek debt decision
- GBP/USD may dip from 1.5500 resistance, but medium-term bias remains higher
- USD/JPY’s snore-inducing trade continues as traders wait for volatility to pick up again
- AUD/USD in play, showing resilience despite negative economic data

* Bias determined by the relationship between price and various EMAs. The following hierarchy determines bias (numbers represent how many EMAs the price closed the week above): 0 – Strongly Bearish, 1 – Slightly Bearish, 2 – Neutral, 3 – Slightly Bullish, 4 – Strongly Bullish.
** All data and comments in this report as of Friday’s European session close **
EUR/USD

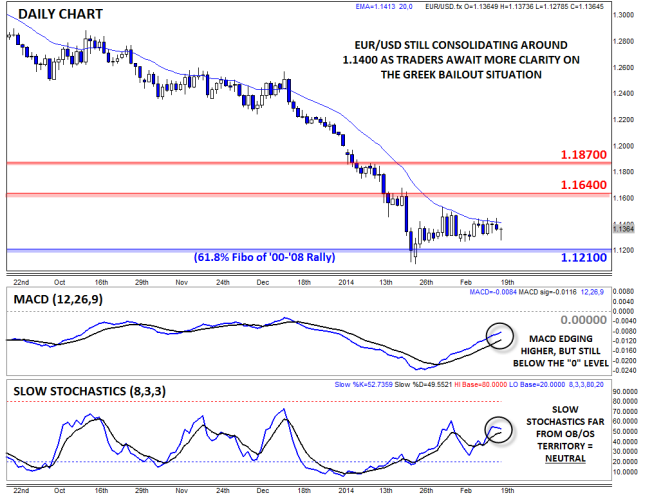
- EUR/USD consolidated in a tight range around 1.14 despite constant headlines from Greece
- The MACD continues to trend higher, showing waning bearish momentum
- Near-term bias depends on outcome of Greek debt showdown
Despite all the headlines out of Greece and the rest of the Eurozone, trade in EURUSD was surprisingly lackluster last week. Rates generally consolidated around 1.1400 as the bailout negotiations stretched throughout the entire week. As it has for the last few weeks, the MACD continued to revert back to the “0” level, signaling waning bullish momentum, though not an outright shift in favor of the bulls yet. Overall, the pair’s technical outlook remains the same: the strong selling pressure in the latter half of last year has dissipated, but buyers will remain wary as long as rates stay below the 20-day MA and, more importantly, key previous-support-turned-resistance at 1.1640.
Source: FOREX.com

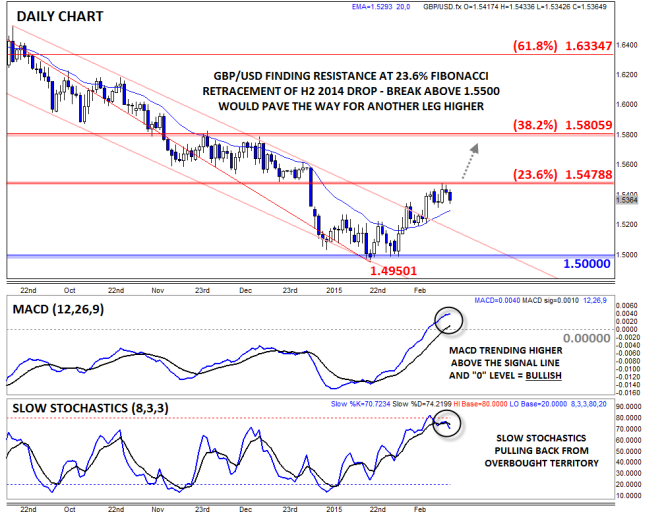
- GBP/USD rallied to its 23.6% Fibonacci retracement at 1.5480 last week
- The MACD is bullish, though the Slow Stochastics are near overbought territory
- Break above 1.5500 could pave the way for another leg higher this week
After forming a clear rounded bottom pattern that formed over the first six weeks of the year, GBP/USD rallied up to the 23.6% Fibonacci retracement of its H2 2014 drop last week. From a technical perspective, the pair may pause at this resistance level, but the trend appears to be shifting in favor of the bulls: the MACD finally crossed back above the “0” level, turning the near-term momentum bullish, though the Slow Stochastics indicator is now near oversold territory, increasing the likelihood of a near-term pause. For this week, a near-term pullback is possible, but the medium-term trend has clearly shifted in favor of the bulls.
Source: FOREX.com
USD/JPY

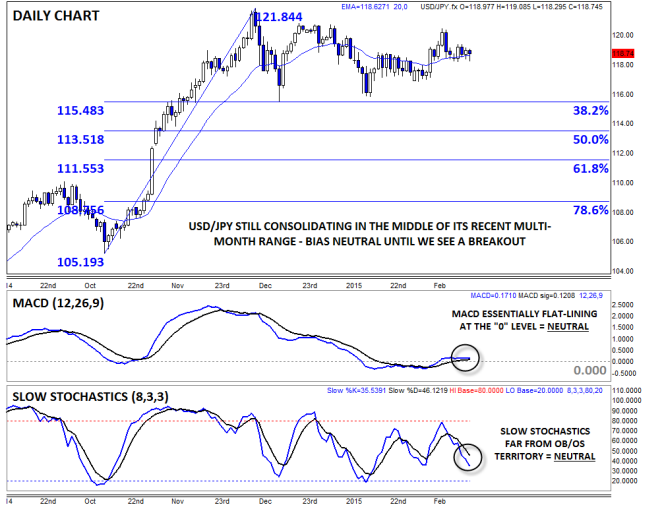
- USD/JPY continued to consolidate in its recent range last week
- MACD and Slow Stochastics show balanced, two-way trade
- Near-term resistance sits up at 120.50, with support at 118.25
USD/JPY traders may have drifted off back to sleep last week as the pair reverted back to its slow, consolidative trading conditions around the 119.00 handle. As it stands, bulls and bears are in an almost perfect equilibrium, with neither side able to make any progress over the last few months now. Not surprisingly, the secondary indicators are showing balanced, two-way trade, providing little guidance on what to expect moving forward. In these types of markets, the best strategy for traders is generally to take their cue from the market – a break above 120.50 resistance could signal a bullish breakout, while a drop below last week’s low at 118.25 would point to a deeper pullback.
Source: FOREX.com
AUD/USD

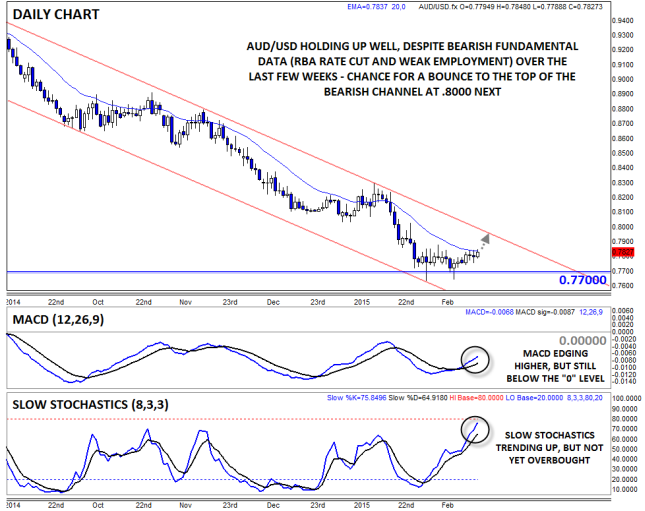
- AUD/USD edged imperceptibly higher in quiet trade
- MACD turning higher, but still well below the “0” level
- AUD/USD’s resilience, despite poor economic data Down Under, suggests possible bottom
AUD/USD is our currency pair in play this week due to a number of high-impact economic reports out of the Australia and the US (see “Data Highlights” below for more). Last week, the pair edged almost imperceptibly higher to .7800 in slow trade. As for the secondary indicators, both the MACD and Slow Stochastics are inched higher, but they are not necessarily providing strong signals one way or another. From a broader perspective, AUD/USD has held up extremely well despite a surprise RBA rate cut and weak jobs report, suggesting that sellers may be growing exhausted around the .7700 handle. That said, any rallies this week may stall out against bearish channel resistance near .8000.
Source: FOREX.com
Grexit: How Would it Work?
At the time of writing, the Eurogroup of finance ministers were still locked in discussions on whether to grant Greece another bailout extension. We are expecting to hear the outcome of the decision at some point on Friday evening. If the Eurogroup wants to avoid excess market volatility then it may choose to announce the outcome of this meeting once the US market has closed at 22000GMT on Friday.
What we know so far:
- Earlier on Friday the Maltese finance minister said that the “German-led” bloc in the Eurozone is willing to let Greece leave the Eurozone.
- Also on Friday a German paper said that the ECB is running contingency scenarios for a Greek exit.
- Greece has a movable public holiday scheduled for this Monday – 23rd February – which could give the Greek central bank time to print drachma…
- The leaders of Europe are also getting involved. French President Hollande said that Greece has to stay in the Eurozone, while the German Chancellor would only say that Greece remaining in the Eurozone was her aim, but she had to see the details of Greece’s bailout extension proposal.
- The Greek Prime Minister said that he was “certain” that the Eurozone will back his bond extension plan; however, it could be a tough few hours for him while he awaits the outcome of the negotiations.
We expect a binary outcome from this situation: either Greece gets its money and stays in the Eurozone, or it doesn’t and it leaves. As we have said before, although a Grexit would unleash a wave of uncertainty into the market, now could be as good a time as any to cut Greece loose, because:
1, The ECB has embarked on QE: This could protect the rest of the currency bloc from excess volatility in the event of a Grexit.
2, Contagion has been limited so far: Even though Greece’s position within the currency bloc is probably the most vulnerable it has ever been, other peripheral nations have been basically unaffected. Spanish and Italian bond yields continue to trend near their lowest levels ever.
3, Growth: The latest PMI data for February, released earlier on Friday, showed the service sector in the Eurozone is picking up strongly (particularly in France and Germany), which helped to push the Eurozone’s composite PMI for Feb back to its highest level since mid-July.
We believe that a deal to extend Greece’s bailout will trigger a relief rally in the EUR and euro-based assets. If there is no deal, but another meeting is scheduled for some time next week, then the market could focus on the next deadline.
Imagining Grexit, again…
The real market fireworks could come if there is no chance of a deal and the Eurogroup and co. make plans for a Grexit. Below are our thoughts on how this could be managed and what to expect:
- The Eurogroup makes the announcement that Greece is going to leave the Eurozone; we expect this announcement to come after the US market close sometime after 2200 GMT on Friday.
- If this happens, then we would expect the Greeks to announce capital controls on all their banks and announce a number of “bank holidays” early next week, to try and manage the situation.
- Over the weekend we would expect a series of discussions between Greece and the Eurozone and another statement before the markets open late on Sunday evening.
- This statement could include a timeline for a “managed exit” from the currency bloc including a timescale for re-introducing the drachma, how Greece will pay back its debts (will they be written off?), how the Eurozone will support the Greek economy, etc.
- A plan of economic support to help Greece manage this transition.
- The ECB is likely to step in to support Greek banks so that they do not immediately collapse.
We believe that the Eurogroup and co. will want to manage this process in the smoothest way possible to ensure that excess volatility does not hit the financial markets and disrupt the Eurozone economy.
However, the consequences of a Grexit announcement in the coming days could include:
- A sharp drop in the EUR, EUR/USD could fall below 1.10 and move back towards parity.
- We could see Italian and Spanish bond yields move higher.
- A rush to safe havens like US Treasuries, UK Gilts, the yen and the Swiss franc. It could also boost the USD, which is also considered a safe haven, and could weigh heavily on risky assets like global stock markets.
- A sharp and devastating sell-off in Greek stocks and Greek bonds (pushing bond yields through the roof).
- A sharp increase in the cost of Greek debt insurance.
- Protests on the streets in Greece (75% of Greek people wanted to remain in the currency bloc when polled before Greece’s January elections.)
- Possible public protests in Germany if Greece’s debts are written off.
The market view:
We have come up with a few scenarios and our view on potential market outcomes:
No deal for Greece – the can is kicked down the road again: This could trigger a small sell-off in the EUR and in European stocks, but the market would most likely focus on the next deadline.
No deal for Greece – Grexit on the cards: This would be the most risk-averse announcement, see above for potential market outcomes.
Greece secures a bailout extension: This is the most risk-positive outcome. We would expect to see the EUR and European stocks rally; Greek assets could also outperform.
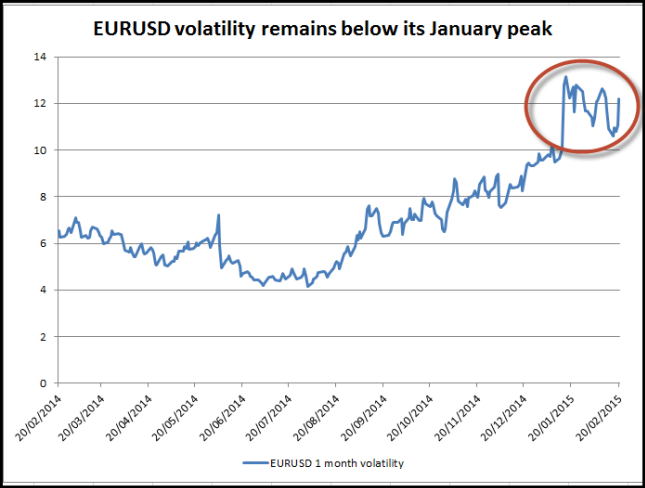
Overall, the Greek situation remains changeable, and the outcome of today’s Eurogroup meeting will be pivotal. Interestingly, EUR/USD is still moving in a relatively tight range as we moved to the end of the London session. Although volatility in EUR/USD has started to pick up, it remains below the Greek election high in January. We think that the market may be too complacent about the risks of a Grexit in the coming days. If a Grexit is announced over this weekend then we could see large gaps in the markets when they reopen on Sunday night London time. We think that the market may be too complacent about the risks of a Grexit in the coming days, and there is a chance that volatility could jump, so make sure that you are prepared.
Source: FOREX.com
The EUR: Why So Resilient?
Even though Greece is trying to avoid exiting the Eurozone this weekend, financial markets are remarkable sanguine. The EUR was trading within a relatively tight range on Friday and by the European close it made fresh intra-day highs. Likewise, European stocks were higher on the week, even though they were weaker on Friday.
So what is going on?
While confusion reigns over what the outcome of the Eurogroup meeting will be, the markets are sticking to their short-term trends. Stocks in Europe have been moving higher as the market prices in the wave of liquidity about to hit the markets next month from the ECB. Although the longer-term trend for the EUR remains lower, in the short term EUR/USD remains in consolidation mode and has been clawing back some recent losses.
EUR gets support from the fundamentals:
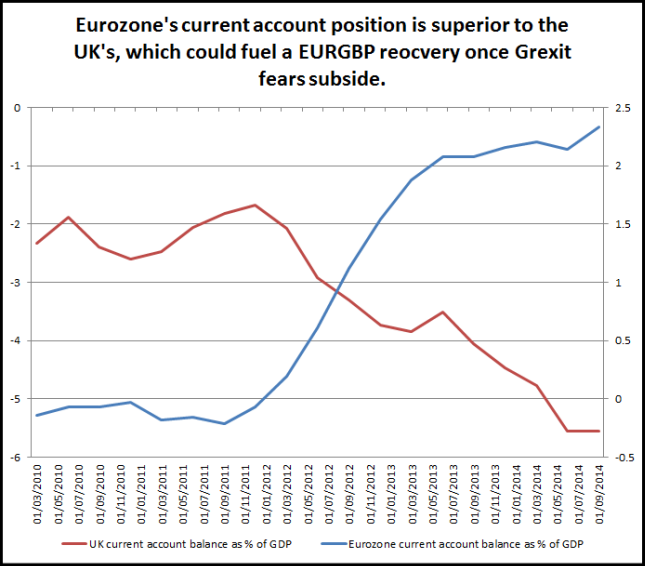
We expect a sharp reaction to the outcome of this Europgroup meeting, and you can see our potential market scenarios in the piece above this. However, from a fundamental perspective, there was another reason why the EUR was so resilient last week. The Eurozone’s trade balance jumped to a record high of EUR 24 billion for December, this helped push the current account balance, which has been trending higher in recent months, to EUR 29bn.
FX 101 says that a country with a trade and current account surplus should see a stronger currency as its financial position improves and investors look to buy countries with “strong” fundamentals. Obviously, the Eurozone has many problems, not least a potential Grexit and high levels of unemployment, however, its surplus status could cushion any EUR downside in the event of Grexit in the coming days.
If a Grexit does not come to fruition in the coming days and the two sides agree to extend Greece’s current bailout, then we could see the EUR/USD rally extend back to 1.16-17 – the highs from mid-Jan. We could also see EUR/GBP stage a mini recovery after falling to a 7-year low recently. Key resistance lies at 0.7600 – the high of the month so far, and then 0.7648 – the 50-day sma. If the market goes back to focusing on fundamentals and FX 101, then the UK’s inferior current account position relative to the Eurozone could help EUR/GBP stage a longer-term recovery ahead of the UK election later this year.
Source: FOREX.com
Look Ahead: Equities
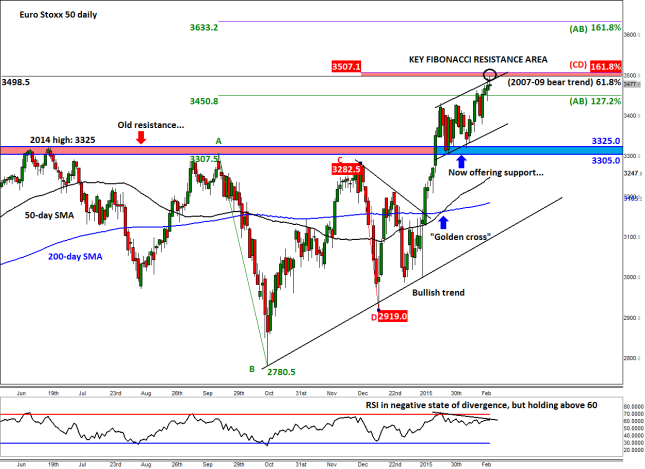
Conflicting reports regarding the future of Greece in the Eurozone meant trading was jittery on Friday morning when this report was written. The Eurogroup meeting was rescheduled for later in the afternoon, so the European markets could be closed when a decision is made. If Greece were to leave the Eurozone we think this will lead to a major sell-off across the board, while if a deal is reached then this could maintain equities’ bullish momentum for the foreseeable future. So far, the resilience of the markets suggests investors are confident that a deal – be it on Friday or at some point next week – will eventually be reached, which is also our base case. In this scenario we think that the potential upside could be significant, for after all some of the major indices such as the Euro Stoxx 50 are lagging behind considerably and may therefore have a lot of catching up to do. In any case, the ECB’s bond buying program as well as the record low and negative interest rates should help to support the equity markets in the long term. There have also been signs of economic growth in the Eurozone lately while sentiment has improved, too. However, if the unthinkable happens and Greece leaves the Eurozone then all bets are off.
From a technical point of view the Euro Stoxx 50 is in consolidation, awaiting news regarding Greece. The overall technical setup is still bullish, however, and will remain that way until proven wrong. This is highlighted, for example, by the rising 50 and 200 daily moving averages and also the bullish trend line. These moving averages are now in the ‘correct’ order following the crossover of the 50 above the 200 SMA; this is also known as a “golden cross.” Following the breakout above these averages in mid-January, the index has gone on to break above the 3305/25 resistance region (the upper end of this range was the 2014 high). This area has since turned into support. But at the time of this writing, the Euro Stoxx index has drifted slightly lower after hitting the 61.8% Fibonacci retracement level of the entire 2007-2009 bear trend at just shy of 3500 and the 161.8% Fibonacci extension of the CD swing at just above 3505. If this 3500/5 area is taken out then it could pave the way for a rally towards the 161.8% extension level of the AB swing, at 3630/5. Interestingly, the RSI is in a negative state of divergence, suggesting that the bullish momentum may be weakening. The RSI divergence here points to a possible correction, although for this to come to fruition it will probably require something extraordinary to happen – such as a Grexit. But despite the RSI divergence and the slight weakness on Friday, the near-term technical outlook on Euro Stoxx will remain bullish for as long as it holds above the 3305/25 support area on a closing basis.
Source: FOREX.com. Please note this product is not available to US clients
Look Ahead: Commodities
Ahead of the weekend gold is seesawing between the negative and positive territories. Unquestionably this is due to the increased uncertainty over Greece with talks about its future membership in the euro zone set to continue well into Friday evening. Gold’s direction next will therefore depend at least partially on the outcome of the Greek situation. As well as Greece, the on-going situations in Ukraine and across the Middle East, among other places, should help to support the view that there is at least some safe haven demand for the metal. Conversely, if the Greek situation is resolved then demand for safe havens such as Gold could fall back. So, when trading resumes on Sunday evening, there could potentially be large gaps across many financial markets including gold.
Meanwhile the revelation in the FOMC meeting minutes released in mid-week that the Fed is thinking about delaying the first rate hike may benefit US equities the most, but it could also hamper the dollar’s rally; a weaker dollar may boosts the appeal of the buck-denominated gold in the short term. In the physical form, central banks are continuing to purchase bullion in large quantities as they diversify colossal amounts of fiat currency reserves into one of the only tangible assets they can hold in their reserves. The physical demand for gold, particularly in China and India, is also set to rebound this year, according to the World Gold Council. However the global supply of gold is still more than adequate relative to demand and unless prices fall further and remain low, production is unlikely to be cut back noticeably. For most precious metal miners, a price of $1000 per ounce of gold is still profitable. Thus, if gold were to stage a massive rally in the coming months or years it would most probably be because of a perceived increase in demand. More likely, it will be because of what happens in the paper rather than the physical market. In this regard, apart from the unthinkable scenario of a Grexit, we don’t see any good reason why investors would all of a sudden purchase huge amounts of gold futures and options. After all, we are potentially heading into deflationary times. Therefore, we remain skeptical that gold’s rally will last long, for we still hold the view that amidst the central banks’ ongoing race to the bottom for interest rates, equities will provide better yields than gold. But that’s not to say gold is doomed, for the reasons just mentioned.
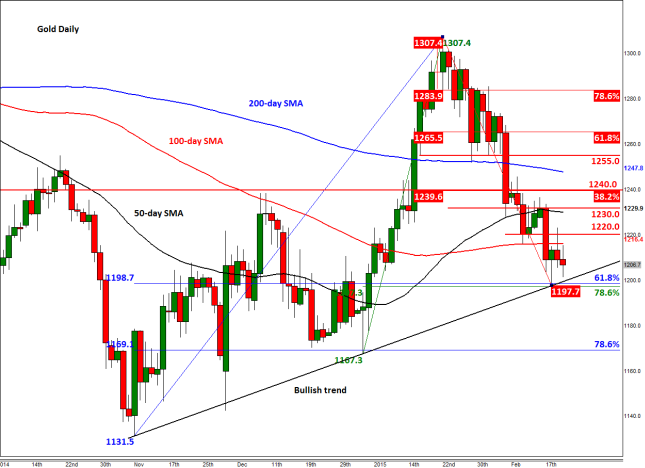
Gold’s mid-week rebound at the key $1200 mark should not come as a surprise for our technically minded readers. We have been banging on about the technical importance of this level for a number of weeks now and fully expected it to drop to this level. The $1200 is a key technical level because first and foremost it is a psychological round number, but more importantly this is where a bullish trend line converges with not just one but two important Fibonacci retracement levels. One of these Fibonacci levels is the 61.8% retracement of the upswing from the November low, which comes in at just below $1199. The other is the 78.6% retracement of the upswing from this year’s low point, at just above $1197. Unsurprisingly, gold’s low point this week was made between these levels, namely at just below $1198, as some bearish speculators booked profit there while the bulls took advantage of oversold prices and went long. However gold has been unable to break back above the previous support at $1220 i.e. this has now turned into resistance. So, while it remains inside this $1200 to $1220 range, the direction of gold’s price is unclear. An eventual break outside of this range could lead to a sharp move in that direction. On the upside, the next level of resistance is the 50-day moving average at $1230, while on the downside the next targets could be $1180 followed by the January low and the 78.6% Fibonacci level at $1167/69.
Source: FOREX.com. Please note this product is not available to US clients.
Global Data Highlights
Monday, February 23, 2015
11:00 GMT Confederation of British Industry Distributive Trades Survey - Realized (February)
This past week, the UK Retail Sales were quite disappointing as most pundits were looking toward the nation in a positive light beforehand, particularly in relation to their European cousins. The ex-fuel decline of 0.7% was particularly disheartening as most expected a decline in fuel due to lower prices, but the lack of a surge in other categories created a bit of pause. If this indicator shows the same pattern for February, the recent rise in the GBP/USD could be short lived.
Tuesday, February 24, 2015
14:00 GMT European Central Bank President Mario Draghi’s Speech
This particular speech isn’t supposed to be that engaging mainly because it is in relation to the release of the new €20 note, but Mario Draghi has a habit of making bold declarations at unexpected times. One example in particular was when he was giving a speech to some financial figures in London before the 2012 Summer Olympics when he stated that he would do “whatever it takes” to save the euro. The relation between then and now is that Grexit talk was rampant, and Draghi may echo a similar sentiment to calm the masses if his currency is under fire.
15:00 GMT Federal Reserve Chairwoman Janet Yellen’s Testimony – Senate Banking Committee
If nothing else, Janet Yellen is consistent. In almost all of the press conferences she gives after the Fed makes a monetary policy decision, she sticks to the line of everything being data dependent. If things are better than they forecast or worse, they will act accordingly. The significance of this event is that there is a new sheriff in town at the Senate as the Republicans have the majority. With all the “audit the Fed” rhetoric being tossed about lately from that side of the aisle, there may be some pointed questions about that topic as well as criticism of the Fed’s Keynesian methodologies. If Yellen sounds more hawkish than the minutes just released this week, the USD could gain even more favor, particularly against the EUR.
Wednesday, February 25, 2015
1:45 GMT Chinese HSBC Flash Manufacturing PMI (February)
Chinese Manufacturing has been stuck in contraction territory according to HSBC for the past two months after gradually falling to that level since mid-2014. Chinese authorities have tried to boost the economy with more easy money from the People’s Bank of China, but that may not have cycled through quite yet. Consensus is expecting another sub-50 print, so any positive surprise could help boost moribund currencies like the AUD and help it get back some of its losses over the last few months.
21:45 GMT New Zealand Trade Balance (January)
The main export for the Kiwi economy is milk, and since the turn of the calendar to 2015, milk prices have soared. That typically means that demand has been increasing, which would be a good thing for the Trade Balance of New Zealand. Consensus is expecting a similar release to last month’s 159M deficit, but if this were to trek back to surplus for the first time since mid-2014, the NZD/USD could improve upon its recent impressive performance.
Thursday, February 26, 2015
0:30 GMT Australian Private Capital Expenditures (Q4)
The fourth quarter wasn’t a very kind one for Australia in a variety of metrics that were released on a monthly basis; therefore, expectations are real high for this release. Consensus is near -1.3% which would be the worst result since Q1 2014, and that consensus might actually be a little optimistic. Regardless, the data is a little old and everyone already knows that Q4 was a struggle, so the AUD might be more influenced by China and whatever is happening with Greece than anything else.
9:30 GMT UK Gross Domestic Product Second Estimate (Q4)
There isn’t any change anticipated from the first release about a month ago of 0.5%, so anything that deviates from that figure could create volatility. Prior to the end of this past week, the GBP was turning in to a darling currency as many felt it had good standing, so if this were to somehow fall, the pullback could be brutal.
13:30 GMT Canadian Consumer Price Index (January)
The Bank of Canada is extremely worried about inflation in the Great White North, so much so that they surprisingly cut interest rates the last time they made a decision. Some would attribute that cut to the perceived currency wars currently in full swing, but of course, they have to worry about their own house before they worry about others. The Core CPI is expected to increase 0.1%, but after seeing the UK Core drop significantly, doubt could reign before this release.
13:30 GMT US Consumer Price Index (January)
In much the same fashion as Canada, the Federal Reserve is uber-concerned about inflation. The most recent Fed minutes showed that many members would be willing to forego a rate increase in the near term just to make sure that inflation heads in the direction they want. Also like Canada, the Core CPI could have the largest impact as everyone knows that falling oil prices have an outsized effect on the main release. Consensus on the Core CPI is standing at 0.1% as we go to press and a miss on this figure could cement the belief that a rate increase won’t be happening in mid-2015.
13:30 GMT US Durable Goods Orders (January)
The CPI release at the same time could get more initial attention, but this release is fascinating mainly due to its seeming inability to be predicted. The last two months are a fantastic case in point as the December release was expected to be a 3.0% rise, but was a 0.7% decline, and the January release was expected to be a 0.6% increase, but was a 3.4% decline. The consecutive drops could point toward a snap back for this release as 1.7% is expected, but as history has shown with this figure, it’s really tough to tell, so it could go either way and have a large impact in either direction for the USD.
13:30 GMT Japanese Overall Household Spending (January)
Since the advent of the increased sales tax in April 2014, this indicator hasn’t been able to get out of its own way. There have been nine straight months of decline after the March 2014 bump as people went out and stocked up on everything before the increase. While a weakening JPY has been helping exports, it hasn’t had the same effect on imports or consumption. If this were to somehow surprise to the upside and get back to positive territory, there could be increased faith in the validity of Abenomics and the plan of the Bank of Japan.
Friday, February 27, 2015
13:00 GMT German Flash Consumer Price Index (February)
The ECB has already introduced Quantitative Easing, dragging Germany along kicking and screaming, but low inflation in Germany could lessen their desire to fight it. Last month’s 1.1% decline is still fresh in the minds of the German people and another drop could make them welcome QE with open arms. Consensus is calling for a 0.6% increase, but considering the recent history of inflation around the world, that may be a little pie-eyed. In fact, Germany hasn’t seen any positive inflation since a 0.3% increase in mid-2014, and considering the continued decline in oil prices, getting anything positive may be an anomaly.
13:30 GMT US Gross Domestic Product Annualized (Q4)
This will be the second release of GDP for the US with the first coming in at 2.6%. The previous couple quarters have provided us with positive increases to the first estimates which really kicked off this whole King Dollar parade we have been witnessing over the past eight months or so. Consensus is calling for a downward revision to 2.1%, so the pessimists are already ruling the day. If it were to somehow increase for a third straight quarter, look out for renewed USD strength.
