In today's DeCarley Perspective we noted the fact that the VIX is trading at historically depressed levels. Specifically, VIX futures near 15.00 and the cash market VIX near 11.00 is a relatively rare event.
Even more interesting, is the fact that the VIX rarely stays at such depressed levels for long. This is because at such levels the market is discounting nearly all event risk. Traders are simply complacent, or as a former colleague might have said, "they are fat, dumb, and happy."
On the flip side, if we are right about the VIX being near a low, the ES should be near a high.

Treasuries are stuck in a rut
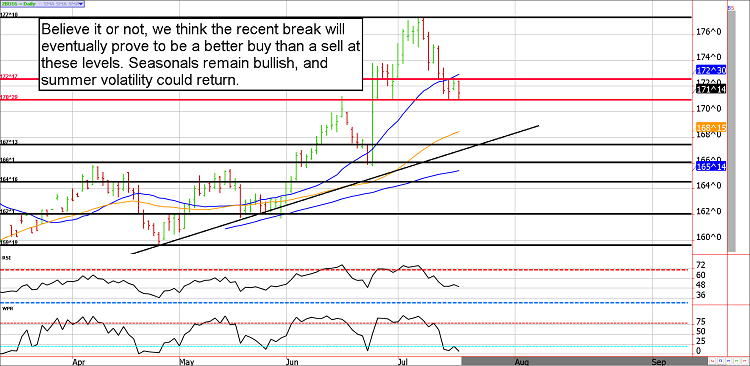
Bonds and notes have spent the last three sessions consolidating the recent sell-off. Further, the daily charts are relatively neutral. The way we see it, the near-term direction in Treasuries carries the same odds of a coin toss. The "easy" money on the downside has been made, but it is probably a little too early to buy. We'd turn bullish should the ZB make its way into the mid-to-high 167s (equivalent to the mid-to-high 130s in the ZN).
Bonds and notes have corrected nicely from recent highs, but sharply bullish seasonals and COT report data suggest we could get another wave of buying. To be clear, we do believe there is a chance at some sort of long-term, or even generational high, in Treasuries at some point this year. However, these types of historical highs and lows are a process, not a single event.
Friday's Commitments of Traders Report issued by the CFTC (Commodity Futures Trading Commission) revealed that large speculators (assumed to be the "smart money") are moderately long the 10-year note, and rather aggressively long the 30-year bond. Further, in the latest measurement period (which ended last Tuesday), they had spent the week adding to bullish bets. On the flip side, small speculators (considered "dumb money") were scrambling to cover shorts in the 10-year note.
Since last Tuesday when these stats were compiled, Treasuries have softened up, leading us to believe that large speculators have lightened up and small speculators have put some short positions back on. In our opinion, this leaves the market ripe for another round of buying. The recent sell-off might turn out to be a "reload" to the rally. MRCI has a seasonal buy in the 10-year note on July 27th.
Treasury Futures Market Analysis
**Bond Futures Market Consensus:** We can't help but think the selling will be temporary in Treasuries.
**Technical Support:** ZB : 170'29, 167'13, and 166'01 ZN: 131'20, 130'25, 130'08, and 128'17
**Technical Resistance:** ZB: 172'17, 177'08 and 178'26 ZN: 132'20, 134'15 and 136'15

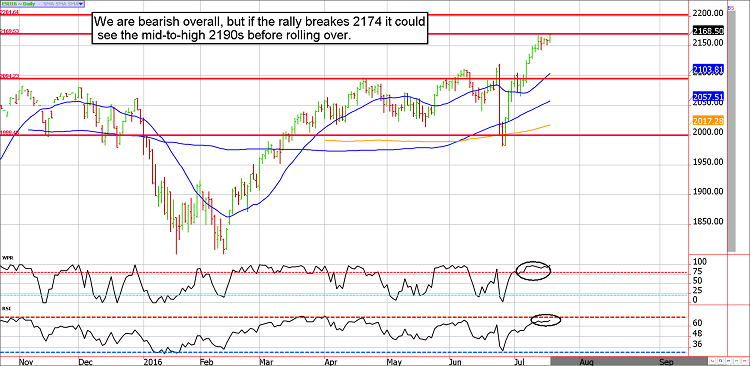
Resistance in the ES near 2174 and again near 2194
We would love nothing more than to see the equity markets roll over from here. However, the reality is we'll probably see another new high before this pattern can be complete. That said, if we do get some sort of blow off high that brings the ES close to 2200, it might be a glorious time to be a bear.
On a side note; we have been expecting some election cycle volatility (which is the norm) yet we've gotten the exact opposite, but there is still plenty of time. The implosion in volatility is severe and probably won't last. Don't allow yourself to become complacent; things can change fast.
Stock Index Futures Market Ideas
**e-mini S&P Futures Market Consensus:** Seasonal high next week, but resistance overhead at 2172 and 2194
**Technical Support:** 2094 and 1999
**Technical Resistance:** 2172 and 2194
E-mini S&P Futures Day Trading Ideas
**These are counter-trend entry ideas, the more distant the level the more reliable, but the less likely to get filled**
ES Day Trade Sell Levels: 2172 and 2193
ES Day Trade Buy Levels: 2145, 2133, and 2124
In other commodity futures and options markets....
June 8 - Sell September corn 520 calls for about 10 cents.
June 14 - Sell September 10-year note 135.50 call for about 18 ticks or $437.50.
June 14 - Sell a November Fed Funds futures contract near 99.57.
June 20 - Sell October live cattle 100 put near 1.20.
June 21 - Buy back September corn 520 calls to lock in profit of anywhere from $300 to $250 per contract before transaction costs.
June 22 - Buy back short ZN calls to lock in small profit and cut risk ahead of Brexit.
June 23 - Go long corn futures near 392 using mini contracts (the beginning of a scale trade). Full-sized contracts can be used if available margin and risk tolerance is appropriate.
June 27 - Sell September ZN 136.50 calls near 26 ticks.
June 27 - Add to bearish Fed Funds futures position by selling a December FF contract.
June 29 - Buy back October cattle 100 puts to lock in a quick profit.
June 30 - Buy September mini (or full-sized) wheat near $4.47.
July 5 - Exit the November Fed Funds futures contract to lock in a profit of roughly $230 to $250 per contract. We'll hold the November contract for now.
July 5 - Add to the long mini corn (or full sized) near $3.45.
July 8 - Buy back ZN calls to lock in profit near 14 ticks per contract.
July 11 - Buy back natural gas calls to lock in gain of about $230 per contract.
July 14 - Sell the corn add-on near 370 to lock in a profit (hold the original entry).
July 14 - Add to the short ES call trade by selling a September 2235 call for about 10.000 in premium.
Disclaimer: **There is substantial risk of loss in trading futures and options.** These recommendations are a solicitation for entering into derivatives transactions. All known news and events have already been factored into the price of the underlying derivatives discussed. From time to time persons affiliated with Zaner, or its associated companies, may have positions in recommended and other derivatives. Past performance is not indicative of future results. The information and data in this report were obtained from sources considered reliable. Their accuracy or completeness is not guaranteed. Any decision to purchase or sell as a result of the opinions expressed in this report will be the full responsibility of the person authorizing such transaction. Seasonal tendencies are a composite of some of the more consistent commodity futures seasonals that have occurred over the past 15 or more years. There are usually underlying, fundamental circumstances that occur annually that tend to cause the futures markets to react in similar directional manner during a certain calendar year. While seasonal trends may potentially impact supply and demand in certain commodities, seasonal aspects of supply and demand have been factored into futures & options market pricing. Even if a seasonal tendency occurs in the future, it may not result in a profitable transaction as fees and the timing of the entry and liquidation may impact on the results. No representation is being made that any account has in the past, or will in the future, achieve profits using these recommendations. No representation is being made that price patterns will recur in the future.
