Making the case for optimism isn’t getting any easier. Although the broad US macro trend is still positive, Mr. Market has lost his mojo. In fact, one econometric technique for gauging the state of the US equity market advises that a bear market has recently started. It could be a false warning, of course, but for the moment it’s clear that market risk has popped up. The main reason for reserving judgment: US economic growth is still positive. There are cracks, but a tailwind is still blowing. The caveat is that economic numbers arrive with a lag. Does the market know something that’s not yet reflected in the hard macro data? Maybe, although Mr. Market’s track record on forecasting the business cycle isn’t flawless.
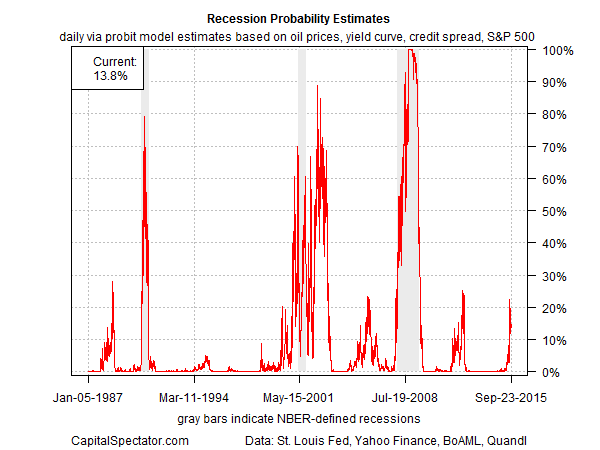
Is a multi-market perspective any more reliable? Perhaps, and so we should consider that a markets-based estimate of US recession risk has turned higher. Higher, but it’s still short of a clear signal that the economy has slipped over to the dark side. Nonetheless, the potential for trouble has increased to the highest level in four years, based on collective “wisdom” of the crowd as expressed through a mix of market prices.
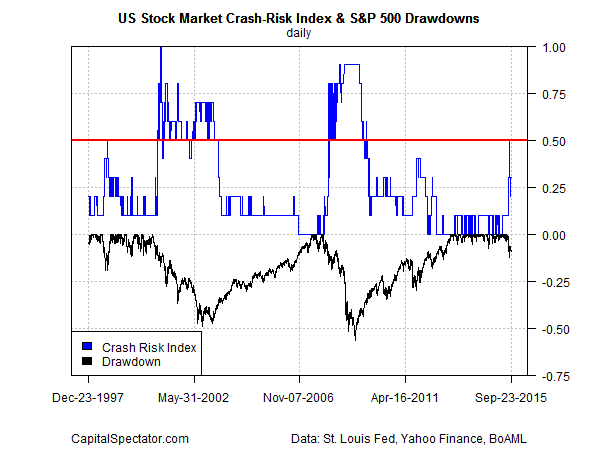
One of the factors weighing on the outlook: the US stock market’s trend, which is mildly negative. Crunching the numbers with a Hidden Markov model suggests that a bear market is in progress for the S&P 500. Two other econometric techniques are also flashing warning signs. But it’s never quite clear in real time when a model’s warning is noise vs. a genuine signal. To reduce the odds of being led astray, it’s advisable to look at a variety of models, which is the design of the Crash Risk Index. As previously discussed, this 10-model benchmark draws on a mix of analytical frameworks to assess the potential for substantial and sustained trouble in the US stock market. At the moment, risk is higher but not yet at the tipping point—0.5—that marks the point of no return.

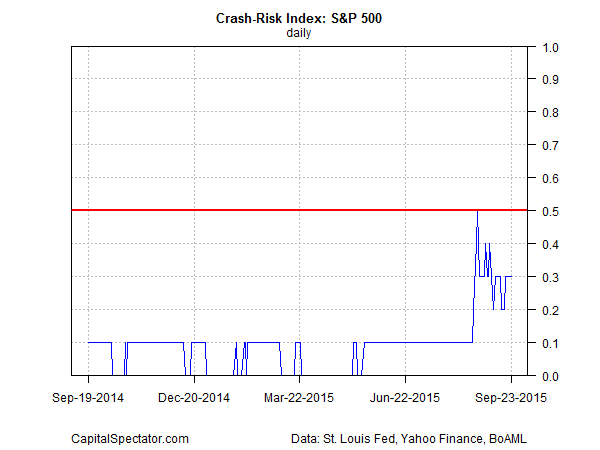
Let’s zoom in on the Crash Risk Index (CRI) and focus on the past 12 months through yesterday (September 23). As you can see in the next chart below, CRI has been elevated lately, briefly popping up to 0.5 before last month pulling back. As of yesterday, CRI is at 0.3, which means that three of the ten indicators are flashing red. Risk is at the highest level since 2011, based on the this multi-model benchmark.
Deciding if the jig is truly up probably relies on whether the US economy stumbles. The available economic numbers overall still point to growth, albeit at a modest rate at best. But the crowd is discounting the potential for macro disappointment. It’s still unclear if that’s the right call, but clarity is due to arrive in the weeks ahead with data updates that will tell us how the September macro profile stacks up. Meantime, the margin for disappointment has faded to nil.


