The NASDAQ served up an annualized return of 66% in its final two years of dot-com mania. Only after the balloon had burst did people begin to question the lunacy of paying 10x revenue for the privilege of being a shareholder.
Ironically enough, since early 2016, the top 10 growth names in tech collectively produced an annualized return of 67%. That’s right. The NYSE FANG+ Index has topped turn-of-the-century craziness.
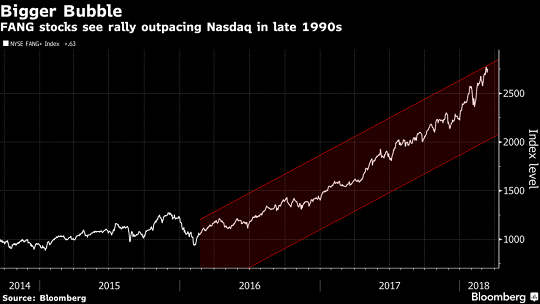
For the current bull-bear cycle, then, we may be witnessing peak FANG fanaticism. Components of the NYSE FANG+ Index like Facebook (NASDAQ:FB), Netflix (NASDAQ:NFLX), Twitter Inc (NYSE:TWTR) and NVIDIA Corporation (NASDAQ:NVDA) currently sport mind-boggling price-to-revenue (P/S) ratios of 13.3, 12.3, 10.9 and 15.3!
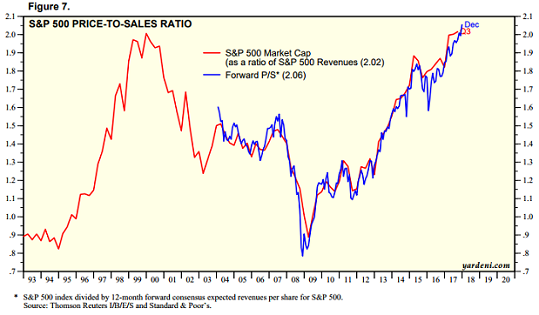
How zany are price-to-sales ratios above 10? For one thing, the S&P 500’s forward P/S above 2.0 is already the most expensive in history. And that includes the tech bubble at the start of 2000.
In the same vein, if one employs traditional valuation thinking, a P/S of 10 implies that a company need deliver 100% of its revenue stream for each year across a decade to provide a 10-year payback. Even with massive tax cut relief and exceptionally attractive borrowing terms, even with share buybacks by the boatload, it is virtually impossible to deliver 100% of corporate revenue stream back to shareholders for 10 consecutive years.
Investors should not pretend that they’re investing in the longer-term profitability of FANG+ components either. Amazon (NASDAQ:AMZN) has been struggling with its cumulative profits and free cash flow for its entire existence. Pretending that the world’s second largest company by market capitalization justifies its forward price-to-earnings (P/E) ratio of 186 because it has transformed business as we know it is preposterous.
In truth, during the current bull-bear cycle, the stock shares of great companies have been getting pushed exponentially higher by machines that employ algorithmic trading. When the bear portion of the cycle hits, the “algos” will crush the overly leveraged FANG+ zealots.
What’s more, a bearish turn may not be far away. Peak FANG+ extremism is one sign. Another in the current bull-bear cycle? Peak corporate debt.
Consider the S&P 500 (ex financials). The median company’s net debt to earnings before interest, tax, depreciation and amortization (EBITDA) has hit a 50-year high.
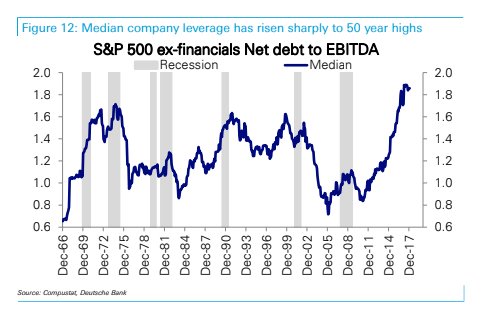
It is not like we didn’t see corporate leverage creating a problem in the last two stock disasters (i.e., 2000, 2008). In fact, excessive borrowing preceded the previous three recessions (i.e., 1990-91, 2000-2002, 2008-2009).
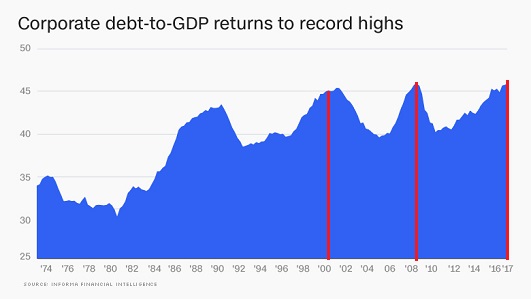
Many corporations simply could not resist the lure of extremely cheap money that global central banks made possible since the 2008 financial crisis. The problem now? The Federal Reserve is simultaneously hiking overnight lending rates as well as allowing its balance sheet to erode so that borrowing costs become more expensive. Similarly, the European Central Bank (ECB) is buying less assets; the tapering is akin to tightening in that borrowing costs around the globe will be more costly.
It follows that sharp increases in key borrowing rates is a risk to corporations that must continually reissue more bonds. As interest rates rise, their costs to service interest expense goes up. That may divert money away from dividends and/or buybacks. It may also take a toll on capital expenditures for growth as well as hinder profitability and profitability perceptions (earnings per share).
Peak corporate debt. Peak FANG fanaticism. Not surprisingly, both may be a function of peak central bank support in the current bull-bear cycle.
Creating tens of trillions in electronic currency credits has been the greatest coordinated experiment in the history of finance. And while there is much debate about the efficacy of worldwide monetary policies, there’s little debate on the exceptionally high correlation between global stock performance and the expansion of global central bank balance sheets.
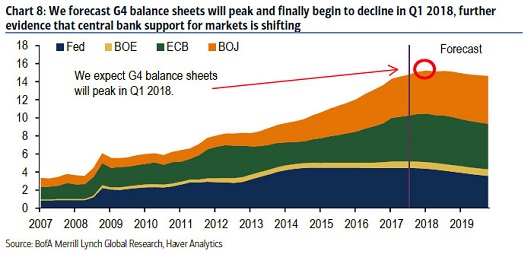
Perhaps it is not particularly shocking, then, to see world stock markets struggle with direction in Q1 of 2018. A number of influential researchers have projected balance sheet contraction to begin here in Q1 of 2018. And unless recessionary pressures build very quickly, central banks are likely to continue tapering and tightening in an effort to achieve a more “normal” borrowing environment.
So if central bank support has peaked, should we be concerned that economies themselves have peaked in this current bull-bear cycle? Quite possibly.
Take a look at real estate. Refinancing just hit a nine-year low. Meanwhile, with property prices surpassing the all-time highs of the housing bubble on a nominal basis, many prospective homeowners can no longer afford payments because of higher mortgage costs. And if the Federal Reserve continues along its tightening path, it’s difficult to imagine home buying rates getting cheaper in the near-term.
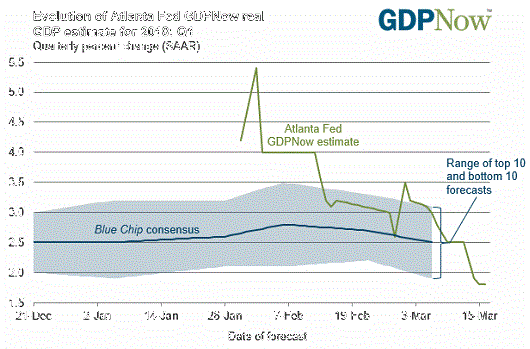
Maybe you think that the recent tax cut package is going to push economic growth into the stratosphere. Yet even the Federal Reserve has dramatically downshifted its own projections for Q1 U.S. economic growth (GDP). It seems that the nine-year economic recovery will still be anchored near an annual average growth rate of 2%, not 3%. Higher borrowing costs from tighter monetary policy are likely to offset the fiscal stimulus of government spending.
Granted, one of the major sources of economic well-being is confidence. And right now, businesses report extraordinary levels of positiveness. Consumers too.
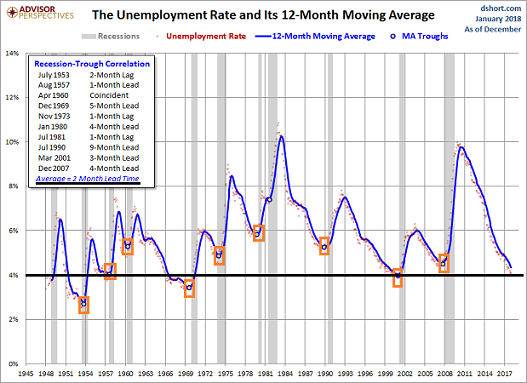
However, this is precisely what tends to happen at peaks. After all, is unemployment more likely to keep falling below the 4% level, or is it more likely to be a point of inflection? If the answer is the latter, history would tell us that recessionary pressures are not that far off.
By way of review, we may be dealing with peak economic well-being, peak central bank support, peak corporate debt as well as peak FANG fanaticism in the current bull-bear cycle. It is also conceivable that we have already seen peak political/geo-political cooperation.
Think about it. The potential threats in the political/geo-political realm are greater than we had in years past. Will trade wars between world economies escalate? Probably not. Nevertheless, you might want to dust off the history books with respect to Smoot-Hawley tariffs during the Great Depression.
Even without a trade war, the notion that central banks will stay in sync with one another is questionable. Whereas the European Union and the United States may be able to remain on the same page, Japan has trillions of yen-denominated reasons not to play nice in the global sandbox.
Specifically, the Bank of Japan’s “yield control” policy of printing as much yen as necessary to make sure that its 10-year government bond remains anchored at 0% may not sit well with other countries. Other nations may view endless yen creation as a way to gain an unfair advantage in exporting goods.
Trade wars. Currency wars. This is not even accounting for the possibility that the Mueller investigation becomes decidedly ugly for Trump’s agenda. Even more challenging? The mid-term elections could swing the balance of power in Congress.
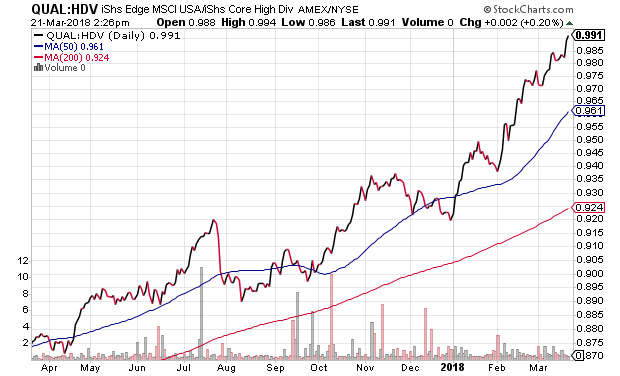
In sum, I look at the current environment in the context of what I call, “peak everything.” And if you’re like me — if you believe that we’re closer to “peak everything” than not– you’re going to want to reduce some of the risk of participation. That means higher quality credit over lower quality credit. It also means a little less stock share speculation and a little more low-debt, strong-balance sheet stock share admiration.
For ETF investors, that might mean favoring iShares Edge MSCI USA Quality Factor (NYSE:QUAL) over reaching for yield in iShares Core High Dividend (NYSE:HDV). Similarly it might mean favoring PowerShares S&P 500 High Quality (NYSE:SPHQ) over higher yielding equity in PowerShares High Yield Equity Dividend Achievers Portfolio (NASDAQ:PEY).
Disclosure Statement: ETF Expert is a web log (“blog”) that makes the world of ETFs easier to understand. Gary Gordon, MS, CFP is the president of Pacific Park Financial, Inc., a Registered Investment Adviser with the SEC. Gary Gordon, Pacific Park Financial, Inc., and/or its clients may hold positions in the ETFs, mutual funds, and/or any investment asset mentioned above. The commentary does not constitute individualized investment advice. The opinions offered herein are not personalized recommendations to buy, sell or hold securities. At times, issuers of exchange-traded products compensate Pacific Park Financial, Inc. or its subsidiaries for advertising at the ETF Expert website. ETF Expert content is created independently of any advertising relationship.
