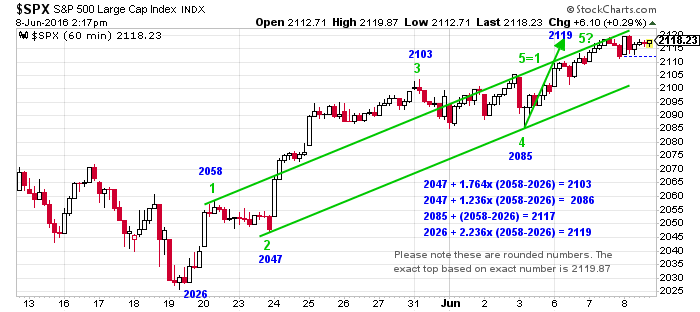
Today, Wednesday June 8, the market surpassed our ideal target of SPX2119.80 by 0.07p. Why is that our ideal target? It is based on our wave-length calculations, and Elliot Wave Theory. We therefore wonder if a top was struck or if we may see a continued slow grind up. Namely, the hourly chart below shows why. Since the S&P500 rallied off its SPX2026 low made May 19th, we're tracking a 5-wave impulse move. The first wave (green 1) was from SPX2026 to 2058, the 2nd wave dropped to SPX2047, and the 3rd and 4th wave went to SPX2103 and SPX2085; respectively. Please note how wave 2 and 4 both bottomed at the green trend line, while wave 1 and the possible 5 hit the upper green trendline. Both trendlines form a perfect Elliot Wave Channel.

Using Fibonacci-extensions we find that wave 3 was 1.764x the length of wave 1, while wave 4 retraced almost exactly 38.2% of all of wave 3. The latter is very common for a 4th wave to do. Then, a 5th wave often equals the length of the 1st wave and that would then target -using rounded numbers- SPX2119ish. Exact numbers give us SPX2119.97. This is also where wave 5 would be at 2.236x the length of wave 1, measured from 2. So far so good.
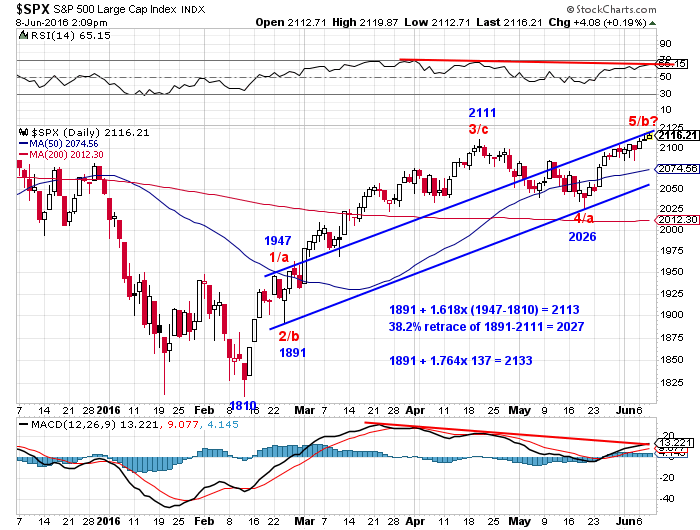
When we zoom out to the bigger picture, and analyse the advance off the SPX1810 low struck in February (see below), we can draw a similar Elliot Wave Channel (now in blue) and possible a 5th wave up forming. Using again Fibonacci-extensions we find that the April high of SPX2111.05 was almost exaxtly the 1.618x extension of the advance from SPX1810 to SPX1947, measured from the intra-day SPX1891 low. The 1.618x extension is rather typical for 3rd waves, but also for c-waves. Hence, the jury is still out there on if we get 5 waves up or not.

One tell tale, as with the hourly chart shown earlier, is that the May low at SPX2026 was the 38.2% retrace of the prior advance; typical for a 4th wave as mentioned above and shown on the smaller hourly time-frame. Hence, we have to keep an open mind on a corrective advance vs an impulse advance. Regardless, of course, the trend is up. But price is contained by the upper blue trendline, and the momentum indicators are weakening telling us that the recent up move is close to running out of steam. Nevertheless, don't count the bulls just out yet. Why? As with the hourly chart, the daily chart suggests using typical 5th wave Fibonacci-extensions and a wave 5=1 relationship that the SPX could still melt up to SPX2133-2164.
Thus, SPX2120 is today clearly important, and may very well be all she wrote for now, though slightly higher prices are not out of the question. Thus the risk/reward is decreasing at current levels for longs in our opinion, and together with the waning momentum, longs should consider be more careful up here (sell into strength would not be unwise).
