Judging by the movements in equities, bonds or currencies as the deleveraging of financial conditions continues incessantly, we seem to have reached the point in the coronavirus saga where the rubber has met the road. Markets hate unpredictability, which is where we are at in trying to understand the possible ramifications for China's and the global growth outlook. While in the context of a tragic context, for traders, this has resulted is a pick up in volatility in line with the heightened uncertainty that exist. If you wonder where we stand in FX, keep reading…
Quick Take
As the coronavirus woes extend so does the upside in the USD, JPY and CHF. These 3 currencies have expanded the gap versus its main peers in the G8 FX space as market participants take no chances and resort to the safe-haven appeal of classic plays. If you ask me, it is no wonder as the outlook for Chinese growth, and a spillover effect, the global GDP outlook is looking bleaker by the day with more than 50 million people in China on lock-down mode and over 100,00 cases diagnosed in Chin alone.
What’s going to be absolutely critical is the rate of reproduction of the disease and whether or not there may be tentative signs that China is able to contain it. While one may take slight comfort from the fact that China seems to be doing all it can, one wonders if it’s too late to mitigate the spreading as it’s thought that more than 5 million Chinese from ground 0 where the virus originated from left the city of Wuhan before the ban on traveling.
It definitely looks like the market may be on tenterhooks for another week or two until there is more clarity on the true outreach of this disease. A currency that depicts like no other the worsened outlook towards China near term remains the Aussie and to a lesser extent the Kiwi, taken to the woodshed as the favorite short play to express the dire view on the Chinese economy to start 2020. There is a third camp of currencies (EUR, GBP, CAD) that found rather stable dynamics notwithstanding the pick up in risk aversion.
This is important to note because this is a week with higher than average trading opportunities for the avid trader to capitalize on the increase in volatility that we are seeing in financial markets, so making a distinction of the most one-sided flows is critical to catch the strongest trends at play. This is a healthy improvement in volatility, even if sadly, once again, for the wrong reasons. Remember, while you definitely must be accounting for the FOMC or Aussie CPI this week, make no mistake, there is a thematic overriding it all, and that’s the coronavirus propagation. The markets are in clear risk-off mode as also reflected by the largest one-day fall in the S&P 500 since October.
Narratives In Financial Markets
* The Information is gathered after scanning top publications including the FT, WSJ, Reuters, Bloomberg, ForexLive, Institutional Bank Research reports.
Risk-off dynamics prevail: Fears of the coronavirus spreading took hold and as a consequence, the S&P 500 had the worst day since October last year, while the global fixed-income market continues to be the place to be (sharply lower global bond yields), alongside a reinvigorated Yen, Franc and the US Dollar, these 3 dominating the FX board.
What's the latest news on the coronavirus? More than 50 million people over a dozen of Chinese cities remain on lock-down mode as China cranks up the efforts to contain the spreading of the epidemic, which so far has cost the lives of nearly 100 people with over 100,000 cases diagnosed, according to a Chinese nurse who blew the whistle on the topic through social media over the weekend. The rate at which new cases are popping up day after day is exponential and quite concerning.
Can the virus be contained? The main driver to panic sell is the fact that with the reproduction rate of the diseases fairly high (2.5-3.5 according to research papers) and the preventive measures potentially too little and too late, there may be hundreds of thousands of more cases in coming weeks with the containment being a challenge. If that’s the case, it may have dire consequences for the Chinese and potentially the global growth outlook, with estimates ranging from Chinese growth shaved between 1% to 2% this quarter. The behavior of the market suggest this is a scenario being discounted as the fall in the CNY, AUD reflect.
Global supply chain at risk? As a prelude of how costly this virus can be to the global economy and its global supply chain, China's Zhejiang province announced that companies are not allowed to return to work before Feb 9. Once these companies run out of inventories, if the fluid situation in China prevents the return of workers into the factories, it may represent a hit to the global supply chain and growth as a result.
Trade relationship between the EU-UK looks bleak near term: The European Commission's Head of Task Force for Relations with the United Kingdom Michel Barnier reiterated its pessimistic stance by saying that there is no possibility of a frictionless trade agreement between the EU and the UK, outlining the Brexit hurdles that lie ahead. Barnier said that there will be no compromise on single market,' never, never, never'.
Trump's impeachment process continues: A sideshow, even if it's necessary to be reporting on, as one never knows all the twists that may occur, is the impeachment process of Trump in the Senate. The market has so far shrugged off this as a non-event as Republican are in control of the Senate and for the impeachment to be enacted, it requires ⅔ to vote in favor of the resolution. The plot has thickened though, as CNN reports, “President Donald Trump's former national security adviser has upended the Senate impeachment trial, and new revelations from John Bolton's draft book manuscript could turn the tide on whether senators call for witnesses.” This follows Sunday night's New York Times bombshell that Bolton's draft manuscript says Trump told him US security assistance to Ukraine was conditioned on investigations into Democrats.
US new home sales hit a 5-month low: US new home sales for the month of December disappointed at 694K vs 730K, even if the rude health of the housing market in the US is undeniable. The downbeat is just a small blip in what’s an otherwise very solid uptrend in the number of houses sold in the US amid low supply. It represents a 5 month low for new home sales with the average selling price rising to $384,500 versus $377,600 in November. The USD barely budged as the focus is elsewhere.
Recent Economic Indicators & Events Ahead
Insights Into FX Index Charts
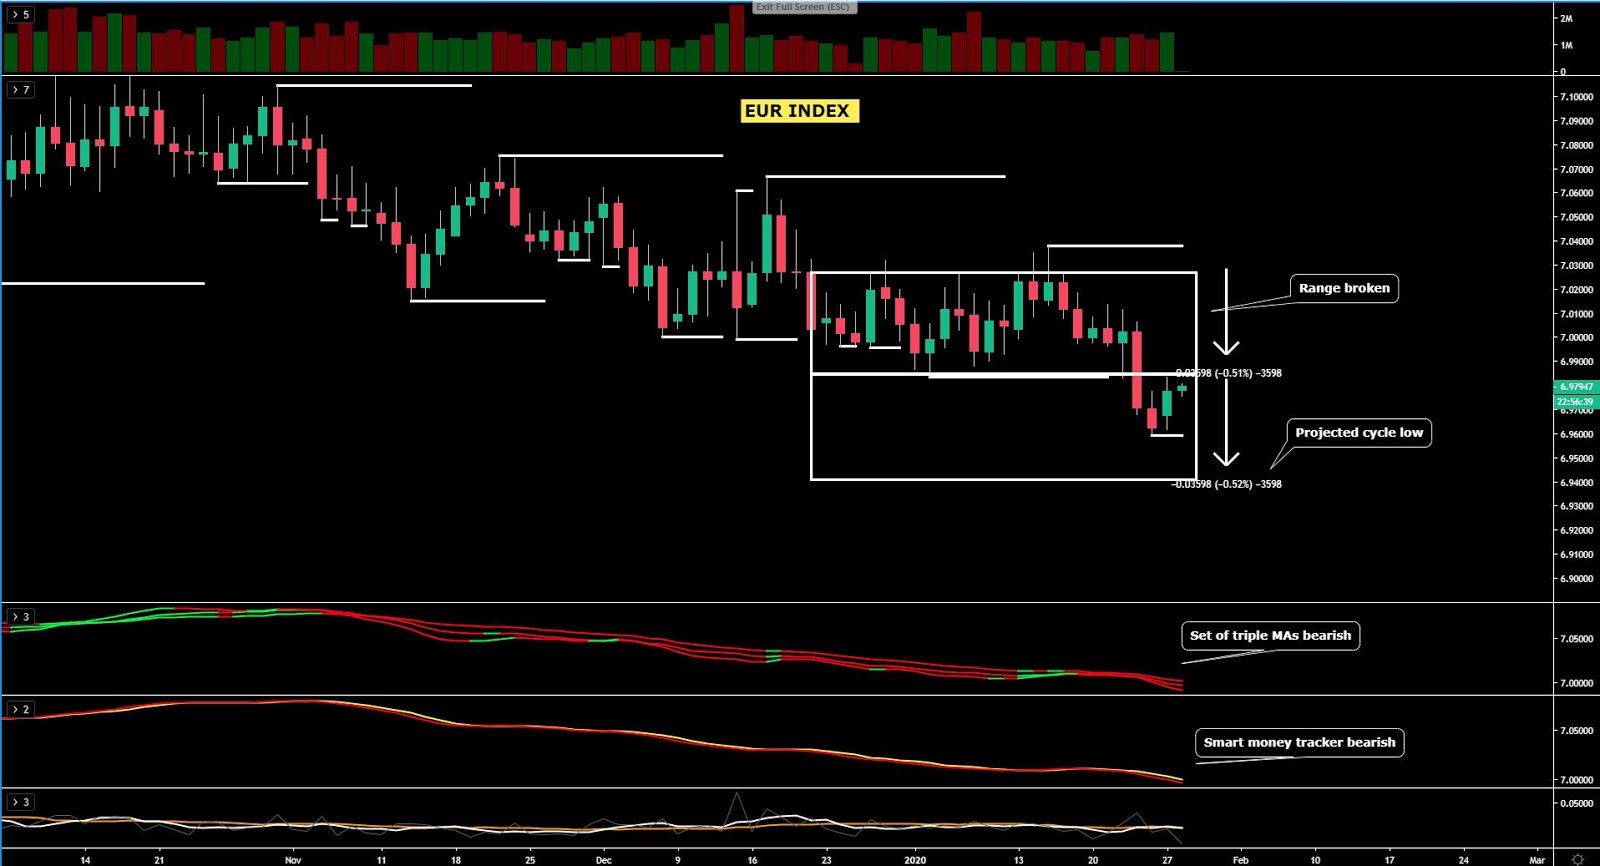
The EUR index is retesting the backside of its broken January range in the context of a well-anchored broad bearish trend from a daily perspective. Technically, it should represent a major challenge for buyers to retake much higher levels as the breakout off the range structure was clean and acceptance was clearly found below the previous support. Besides, the sell-side campaign is still ongoing as the 100% measured move (proj target) is still to be met. Therefore, my base case is for the EUR down-cycle dynamics to stay in place for the time being. The visual cues via the smart money tracker moving averages are unambiguously bearish too. The move lower in the EUR is congruent with the negative seasonals the currency faces in January.
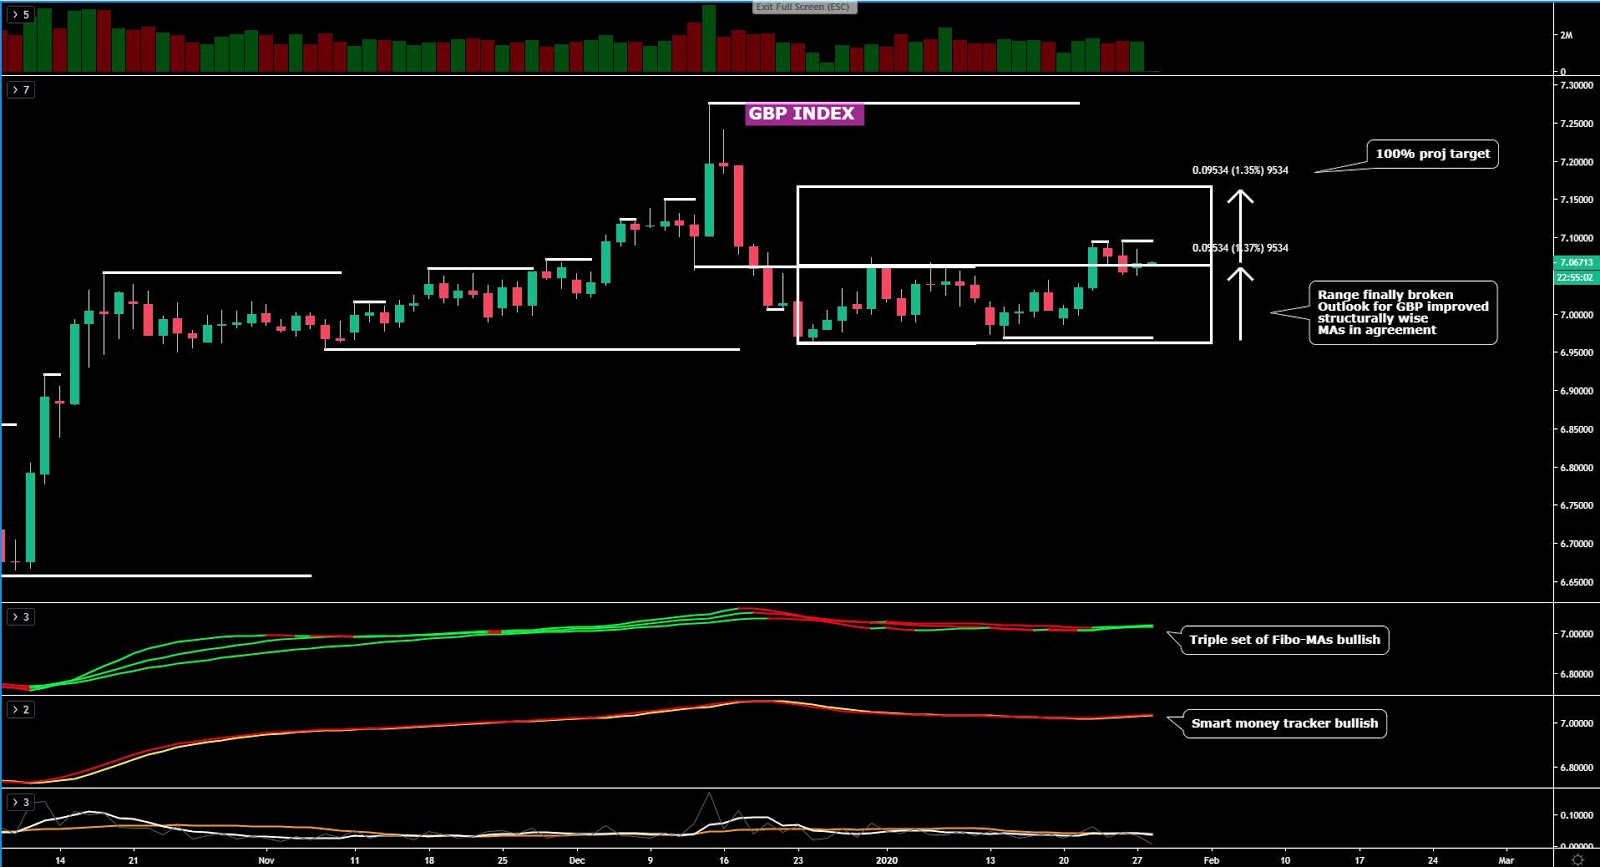
The GBP index has found equilibrium above its prior double top, which constituted the high of what became a broken range last week. Based on technicals, the main bias remains to buy on weakness as the core approach, a view backed up by the price structure and moving averages that most accurately track directional movements (smart money). The buy-side campaign towards the next 100% proj target remains the base case, a gain of ~ 1.35% from current levels. Bear in mind, the BOE meets on Jan 30 (a rate cut this week is a con flip with 50/50 priced in), hence technicals will be trumped by the policy decision, hence why lightening up exposure on GBP ahead of the event is a sound measure to control unnecessary risks.
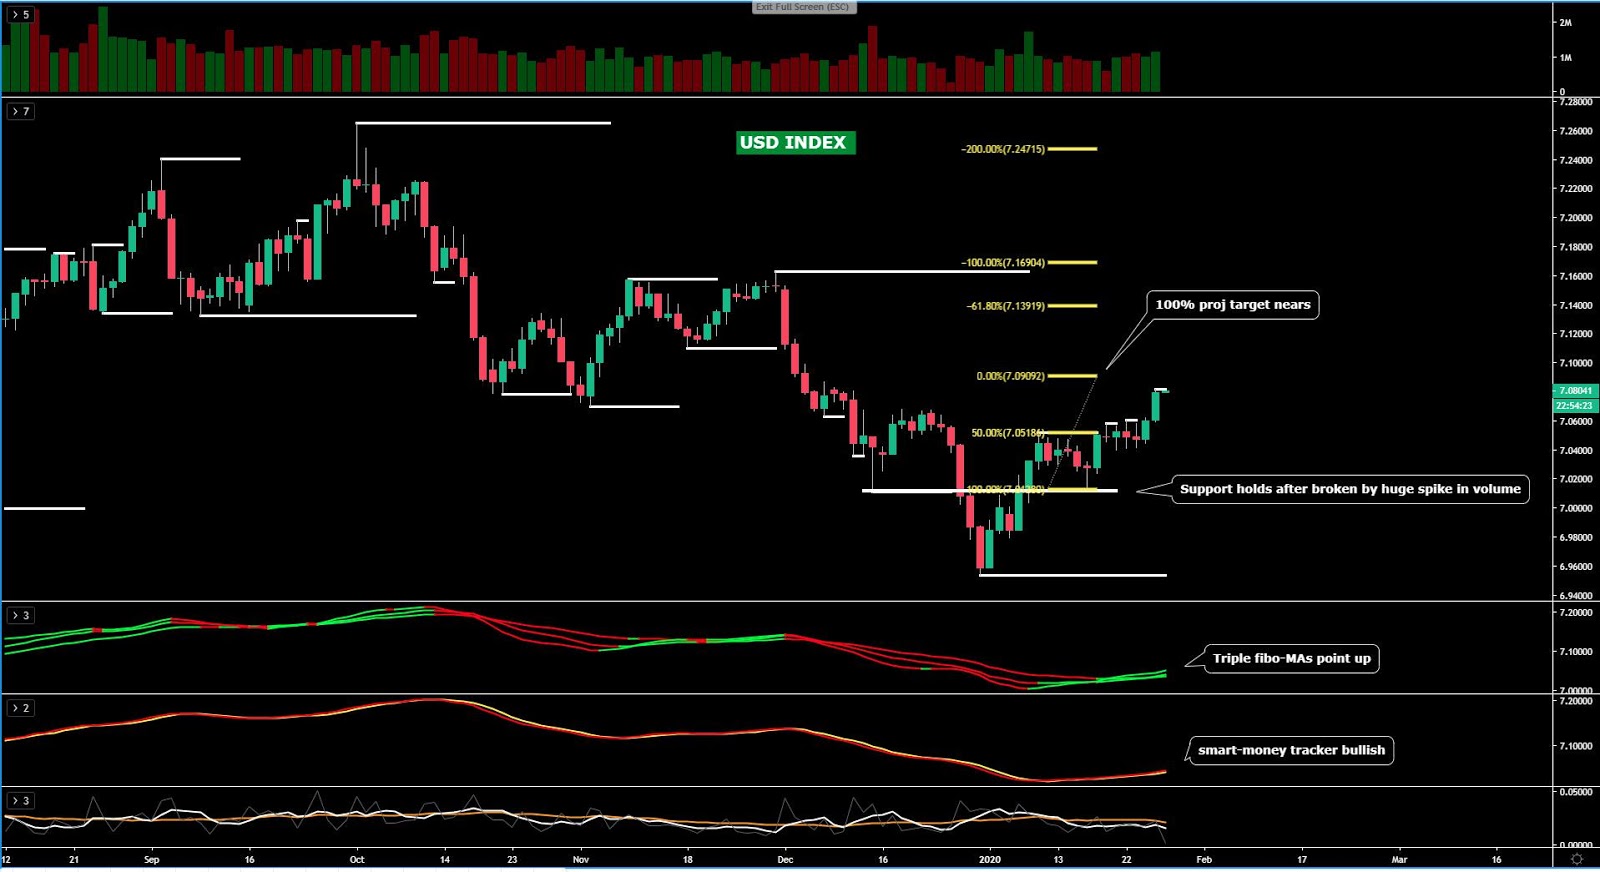
The USD index keeps expanding to the upside, a movement in complete agreement with the constructive technical outlook promoted in this report through most of January. There is further room for the index to appreciate until the 100% projection target gets hit. The increase in buy-side volume on Monday, alongside the solid close by NY close, only reinforces the long bias. The bullish view finds the backing of all the critical elements I personally monitor to define a bias such as the price structure, coupled with the smart money tracking moving averages all pointing higher. The risks continue to be clearly skewed to the upside. The icing on the cake has been the support of seasonals in the month of January, the best month of the year for the USD.
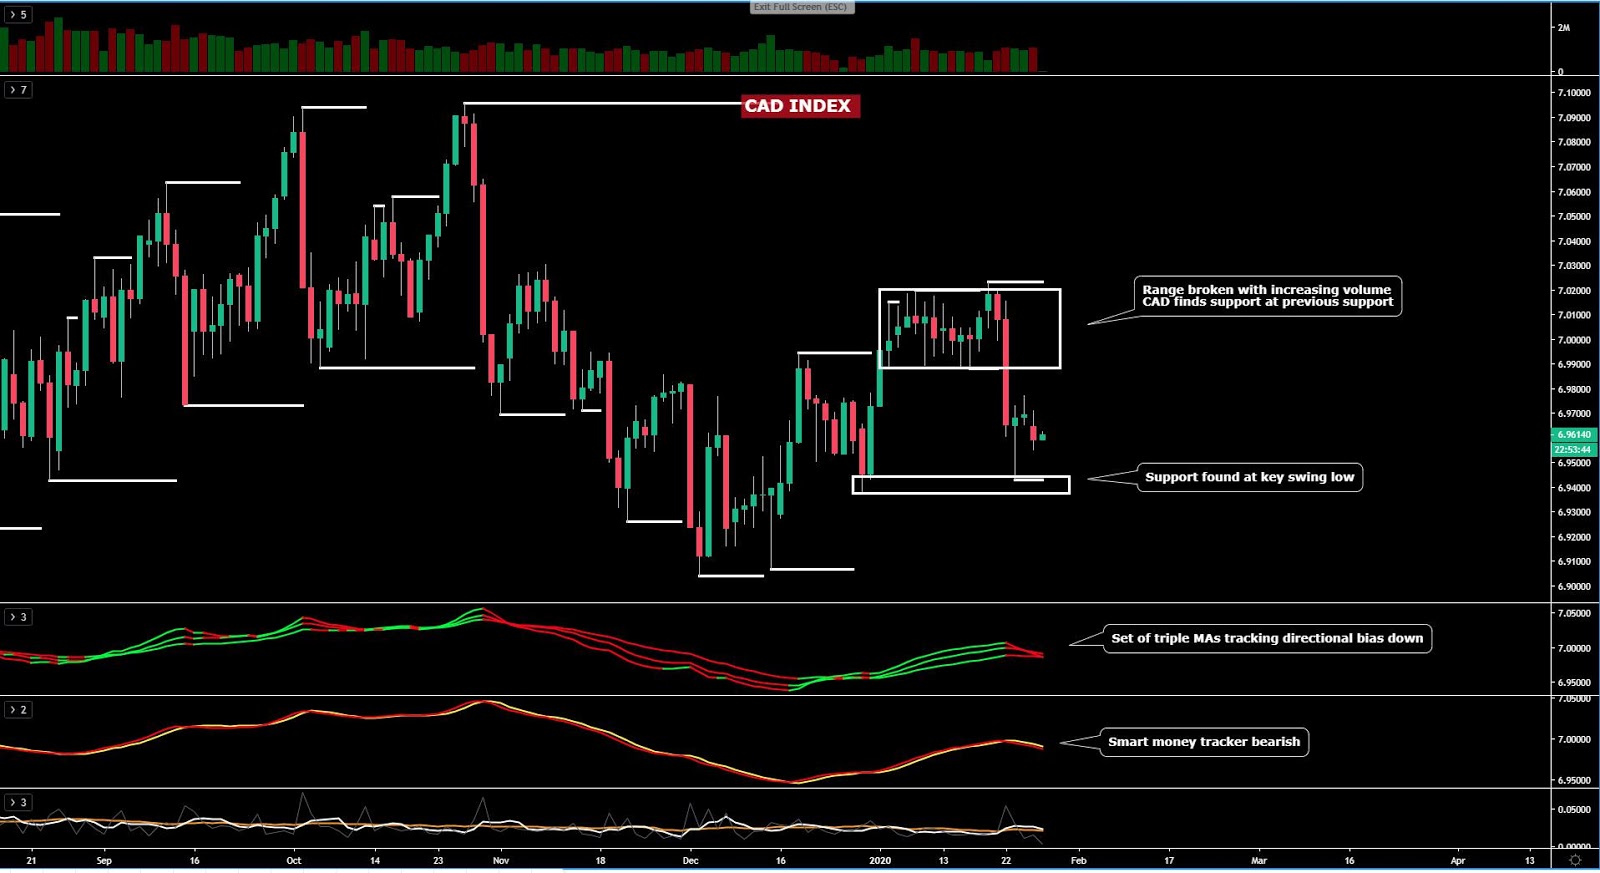
The CAD index shows no changes to its bearish outlook, a view that is supported by the latest bombshell from the BOC to turn unambiguously more dovish. On the back of finding support at a key swing low in the chart after an overextended downside move, and while there may be further upside based on the removal of liquidity into higher attractive levels, this is a market that remains a sell on rallies in line with the price structure and the set of moving averages tracking the smart money directional flows. While the seasonals for the CAD are positive in January, the 180-degree turnaround by the BOC hinting a cut overrides these statistics.
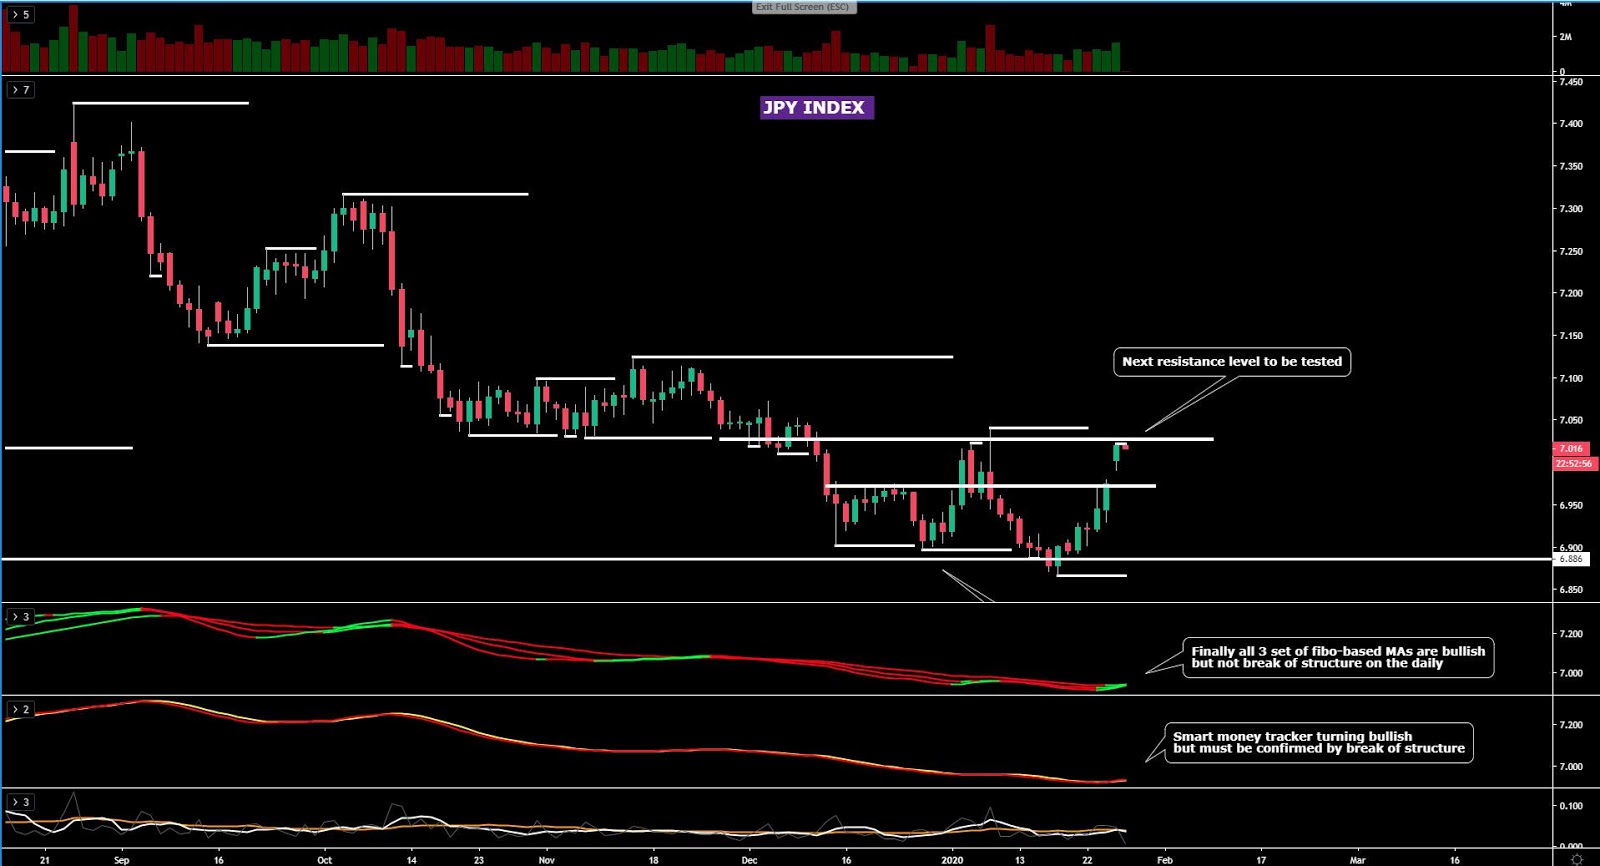
The JPY index has finally landed at a critical inflection point in the form of a macro horizontal resistance, which is precisely where the upside has stalled by the end of business in NY. While the moving averages tracking smart money flows point at a bullish environment, we need to see a breakout of the price structure to gain confidence on the commitment by the slow money. So far, courtesy of the panic selling driven by the coronavirus woes, the JPY has undoubtedly benefited as shorts were unwound and fast money jumped on the bandwagon. However, this is the level that represents a real challenge technically speaking. Should risk-off prevail, the JPY will remain the currency of choice to seek protection from the deleveraging of financial conditions. What’s clear is that opportunities to find trades will keep popping up at regular intervals as the volatility in the currency keeps rising.
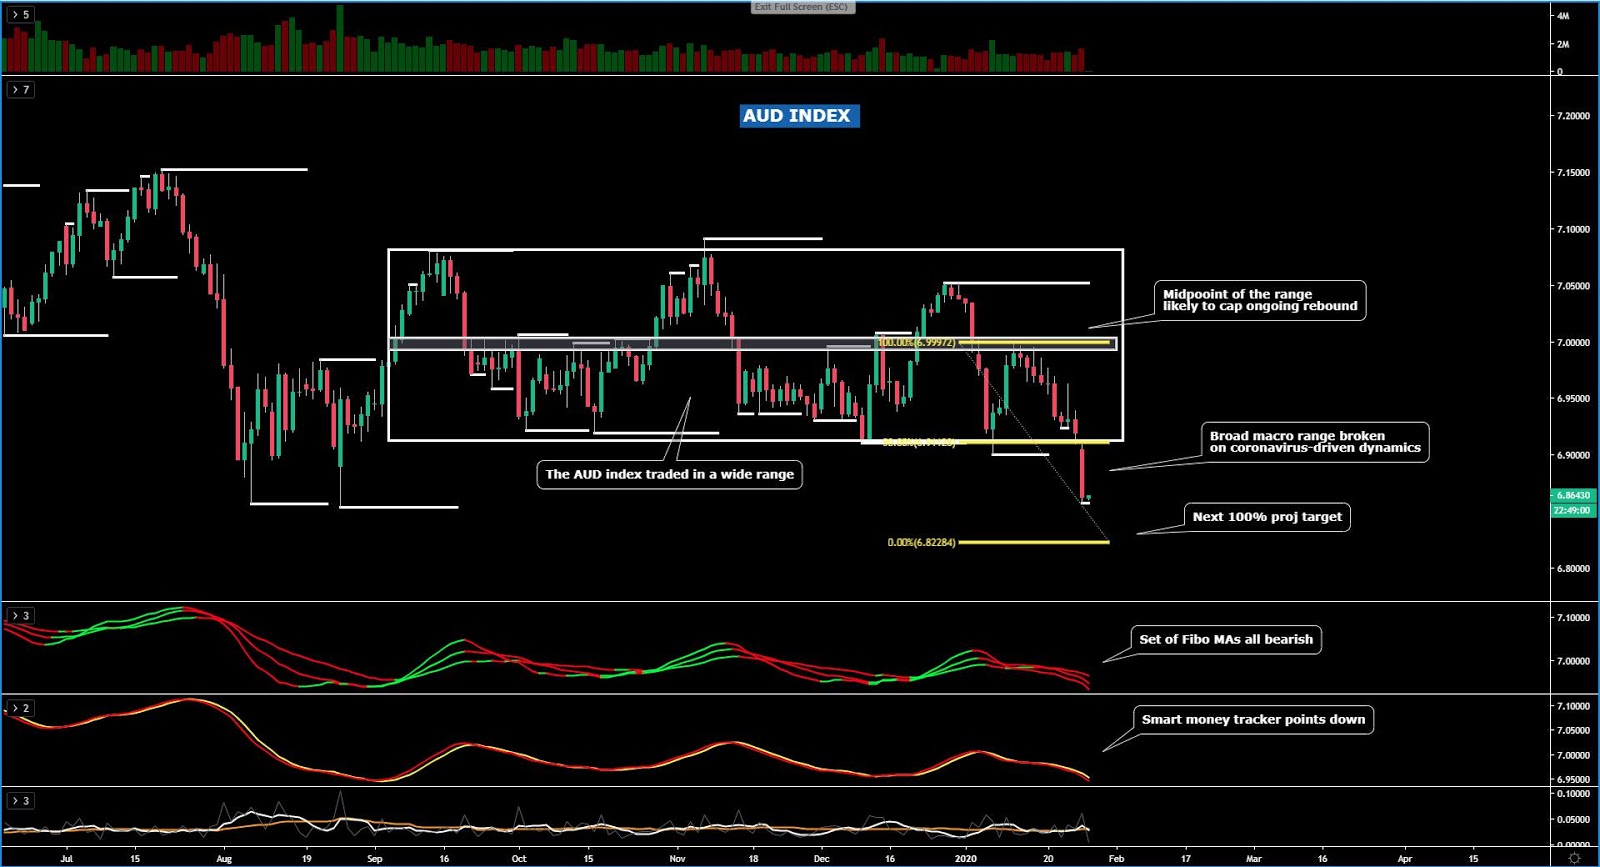
The AUD index has well and truly broken its broad range, one that was in place since Sept last year, as the market keeps dampening AUD-long inventory as the coronavirus crisis puts a major dent in the prospects of Chinese growth, hence AUD succumbs as a proxy. The fall in the Aussie continues to reflect that the currency is the most fragile to the current news driving markets and with all the technical indicators pointing down and the 100% proj target yet to be met, the adoption of selling on strength strategies is a sensible approach to subscribe to.
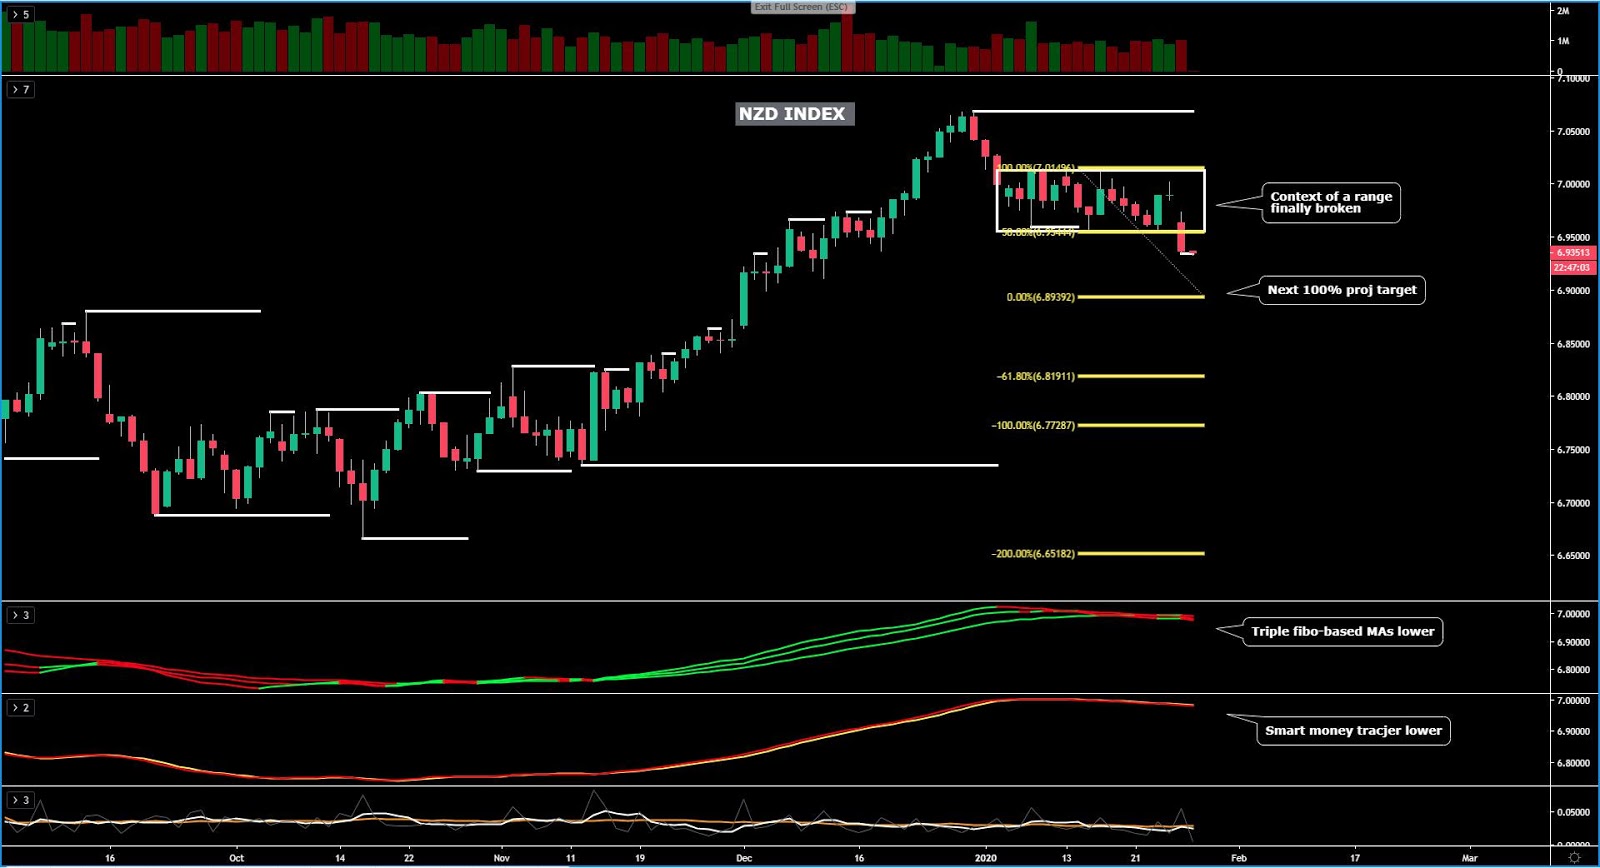
The NZD index has finally found a resolution outside of its short-term range, leading to the worsening of its outlook as the new base case is for the 100% proj target to be hit next. This means that around 0.5% of downside exposure is likely before buy and sell flows balance out. With risk aversion not abating, the NZD, akin to what we are seeing with the AUD, is a currency with susceptibility to weaken further, an outlook not challenged by bearish technicals. Being a seller on strength is a view that now gets cemented by what price action depicts in the chart.
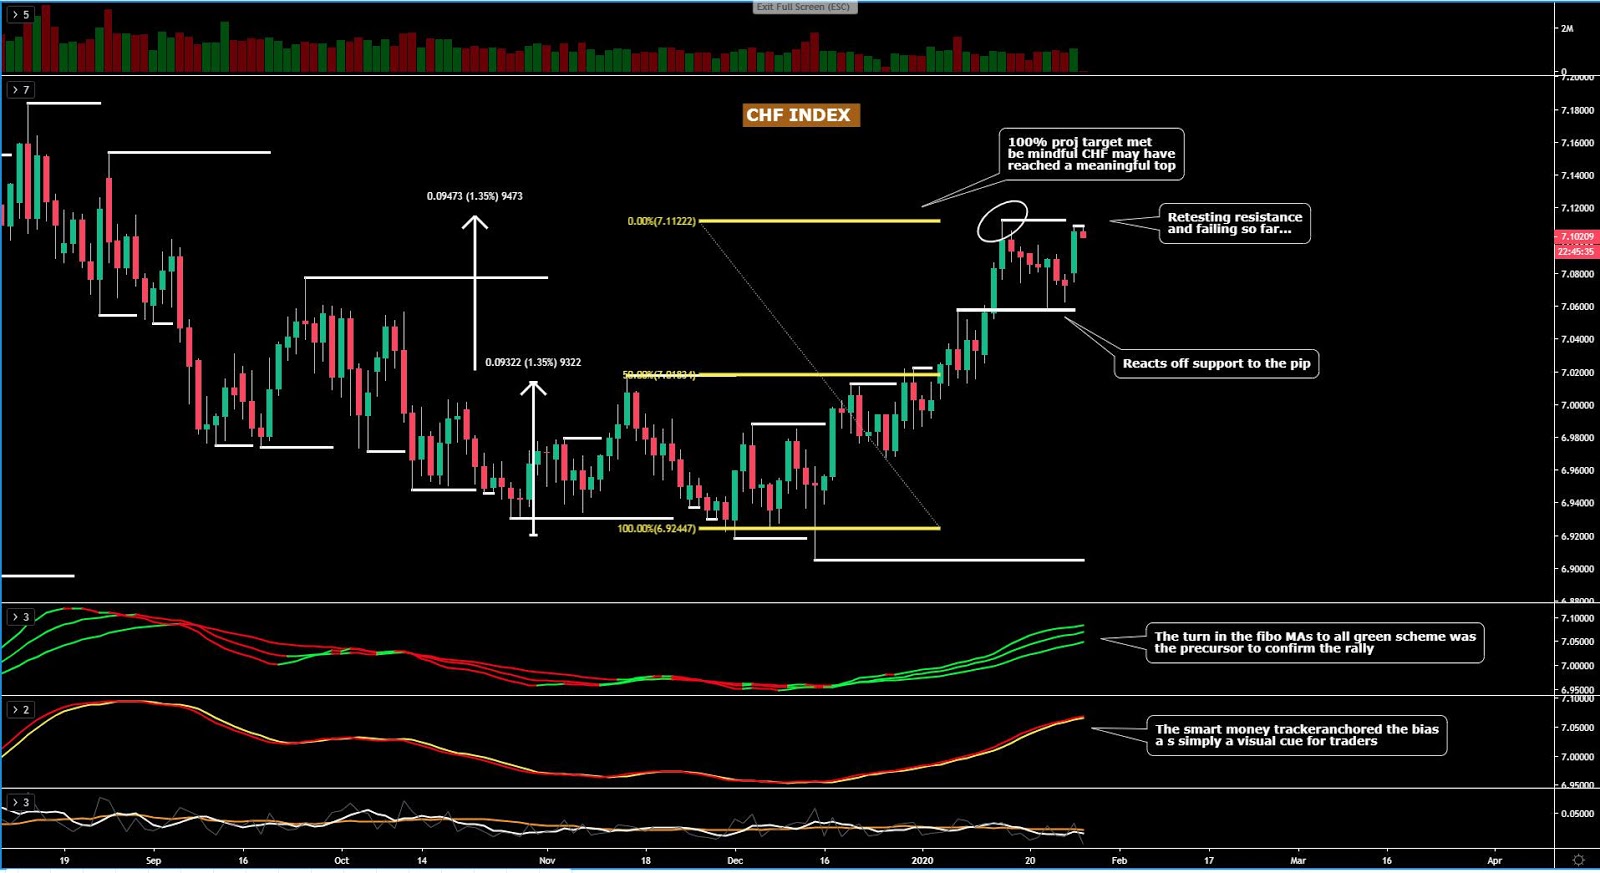
The CHF index continues to trade confined between two key critical levels. To the upside, the bullish momentum stopped on its tracks at the symmetrical 100% proj target where supply pockets via market makers, profit-taking activity and contrarian traders emerged. To the downside, the index has seen multiple bounces a key horizontal support line. There are technical risks that the market morphs into range-bound conditions, even if that remains highly subject to the dynamics in risk flows currently driving markets. CHF remains a top performer this month.
Important Footnotes
- Market structure: Markets evolve in cycles followed by a period of distribution and/or accumulation.
- Horizontal Support/Resistance: Unlike levels of dynamic support or resistance or more subjective measurements such as Fibonacci retracements, pivot points, trendlines, or other forms of reactive areas, the horizontal lines of support and resistance are universal concepts used by the majority of market participants. It, therefore, makes the areas the most widely followed and relevant to monitor.
- Fundamentals: It’s important to highlight that the daily market outlook provided in this report is subject to the impact of the fundamental news. Any unexpected news may cause the price to behave erratically in the short term.
- Projection Targets: The usefulness of the 100% projection resides in the symmetry and harmonic relationships of market cycles. By drawing a 100% projection, you can anticipate the area in the chart where some type of pause and potential reversals in price is likely to occur, due to 1. The side in control of the cycle takes profits 2. Counter-trend positions are added by contrarian players 3.
