The S&P 500: Analyzing Multiple Views
Yesterday's market action was yet another extreme roller coaster ride that ended with the S&P 500 substantially in the red. Today, Yellen's Fed statement will be released and there has been discussion that this will be the most important Fed statement to date. To better understand how critical it is for Yellen's speech to please the market we need to take a look at multiple views of where the S&P is now.
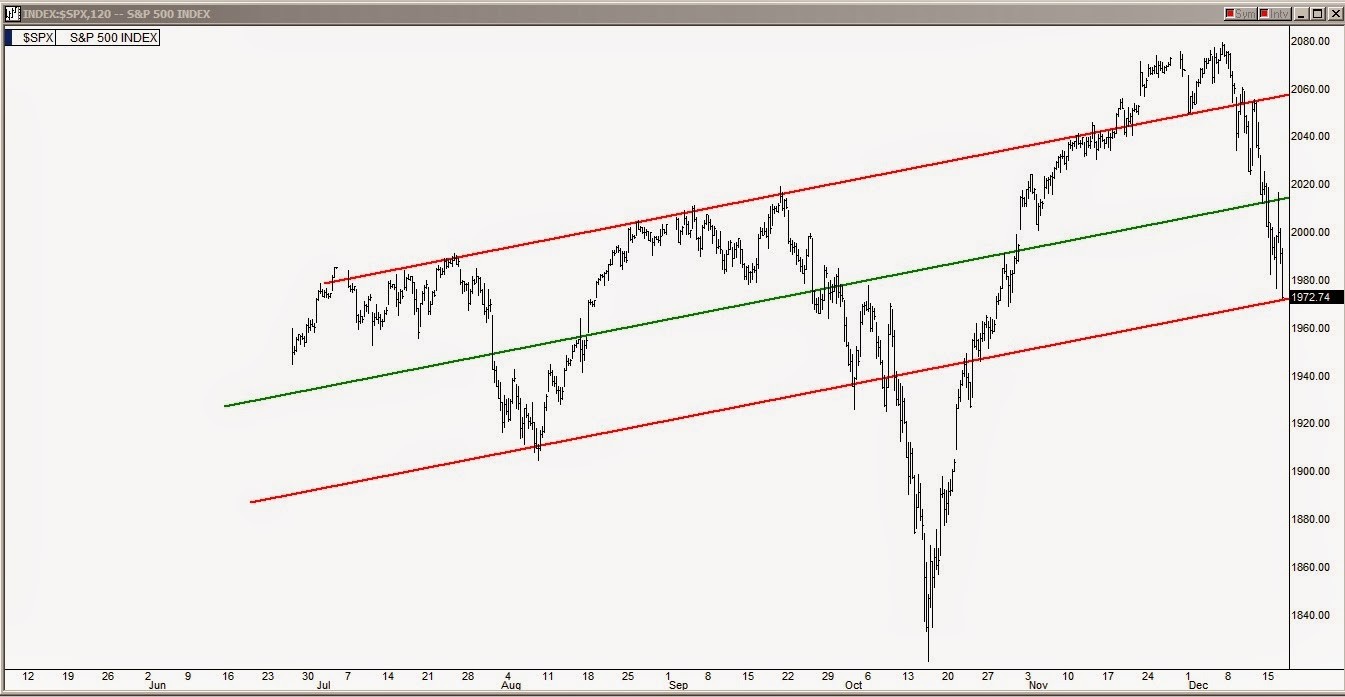
Taking a look at the 6-month chart above of two-hour bars, we can see that the S&P 500 closed right at the lower line of its short term channel. It would be reasonable to expect that failing that line again would have the same consequences as when it failed in early October. We got just as overextended with this last run up and now the market has geopolitical pressures and plunging oil that weren't there to any degree when we failed the line in October.
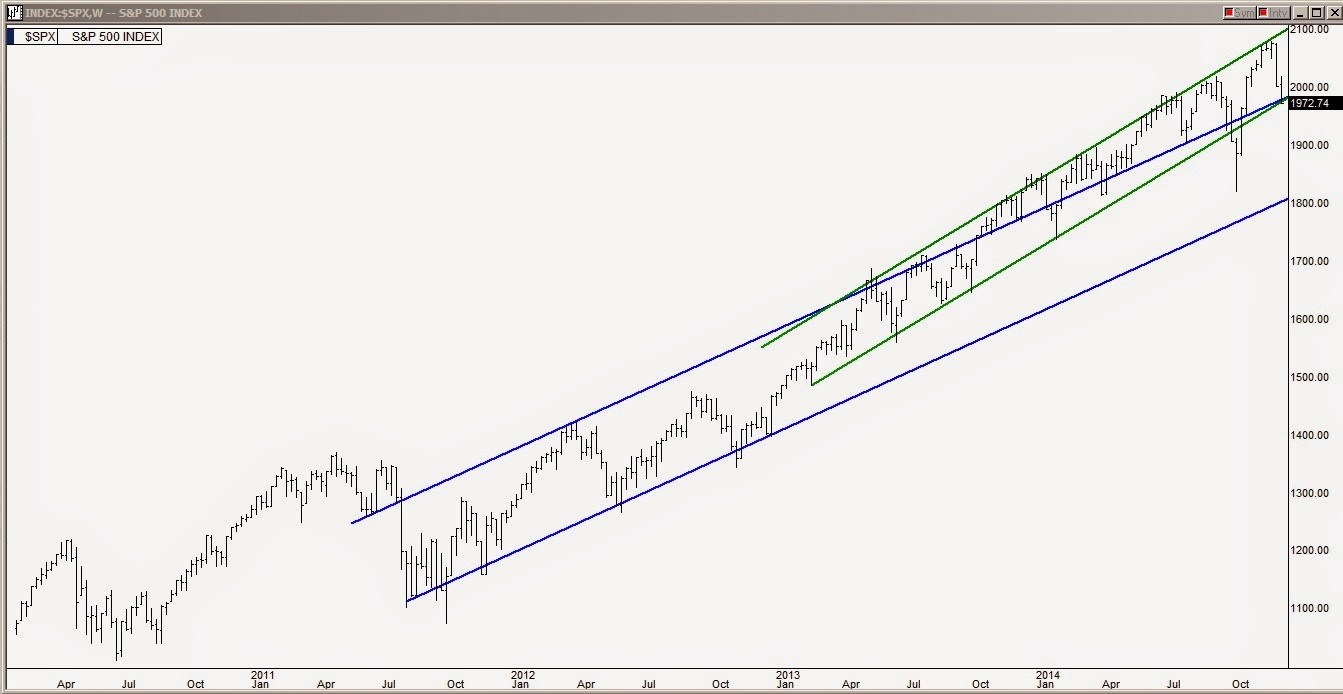
The weekly bar chart of the S&P 500 chart above shows the three-year midterm channel with blue lines and the two-year midterm channel with green lines. Yesterday's close has the S&P 500 barely hanging on to the lower line of the green channel whereby just a 1 point move lower will put it back into the blue channel which is still a very bullish channel. The danger of resuming trading in the blue channel is that there is about 165 points down to the lower line and a visit to the lower line would be normal if the S&P uses that channel to continue higher next year.
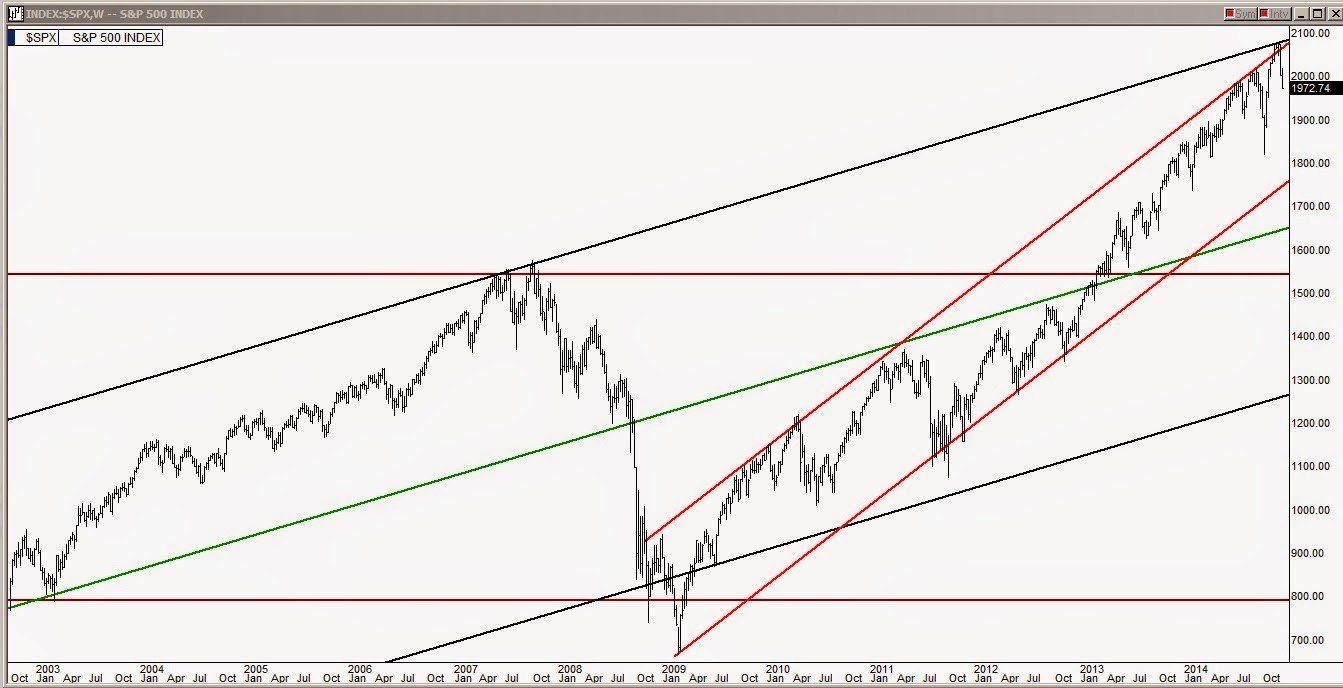
In the chart above, we see the entire 6-year bull run shown with the red channel and also the 20-year incline channel shown with the black lines. Last month the S&P 500 reached the upper line of both the 6-year bull run channel and the 20-year incline channels.
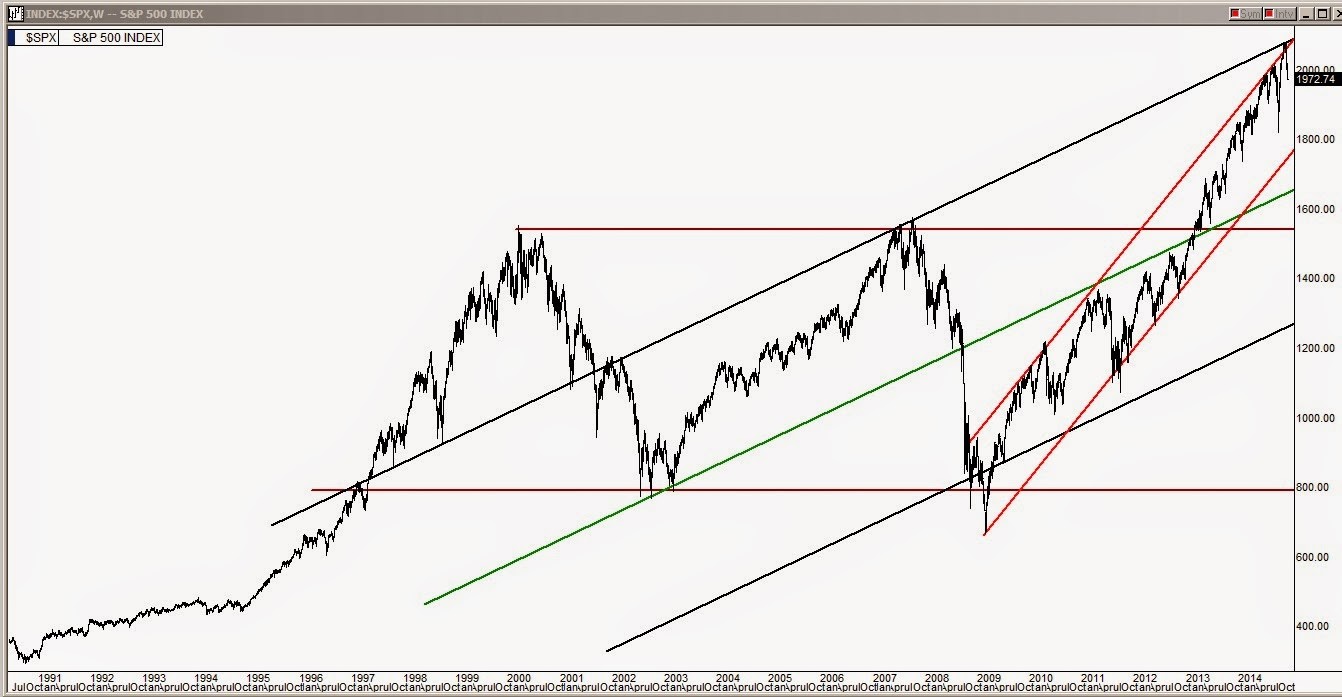
The last chart above is actually the previous chart but zoomed out considerably to really see the bigger picture. This chart shows the entire 20-year incline channel. Considering where the S&P 500 is at right now on all of these charts, Yellen's statement today could truly be a historical marker. If she keeps the "considerable time" phrase the market might react favorably and turn bullish for a while as it is fairly oversold short term and has a lot of trend lines to bounce off from. If the phrase is removed and is not replaced with a new favorable perspective on current economic conditions, the market could easily slip through all the trend lines in the top two charts above and a sustained fall could develop quickly. As usual the two hours following the monthly Fed speech are ruled by the Fed's FOMC day algorithm buying program and we normally don't see the true reaction until the next trading day.


