
T2108 Status: 32.6% (one month high)
T2107 Status: 25.3% (highest close since flash crash on 8/24/15)
VIX Status: 21.4
General (Short-term) Trading Call: Bullish
Active T2108 periods: Day #2 over 20%, Day #1 over 30% (ending 18 days under 30% – a correction from previous posts), Day #21 under 40% (correction from previous posts), Day #82 under 50%, Day #99 under 60%, Day #297 under 70%.
Commentary
Financial markets continue to surprise me. In the last T2108 Update announcing the end of the last oversold period, I guessed that the S&P 500 (via SPDR S&P 500 (NYSE:SPY)) would make no further progress until the conclusion of the Fed’s coming decision on monetary policy. Instead, markets seem to be rolling out a welcome mat for the decision. Calling the coming event “Fedageddon” even sounds like a bad misnomer now. The S&P 500 gained 0.9%, and T1208 closed with a VERY strong surge to 32.6% from 23.9%. This follow-through day essentially confirms that the market is likely done with agonizing and thrashing in an oversold period for a while.

The S&P 500 breaks out above a rising wedge pattern. The 50DMA looms as the next point of resistance.

T2108 surges toward its downtrend in a VERY important test of the exit from oversold trading.
I cannot over-emphasize the (short-term) bullish potential of both these moves given everything the market has conquered over the past month. The S&P 500 has now broken out to the upside from a rising wedge pattern. The index looks like a lock to challenge overhead resistance at the downtrending 50-day moving average (DMA) in short order. A test of that critical resistance will coincide with the open of the first day of the first oversold period. Just as I used the downtrend in T2108 (and T2107) as warnings of weakening underlying technicals, a breakout by T2108 of its downtrend would generate an incredibly bullish signal for the underlying technicals of the market. As usual, I will take it a day at a time, but I just wanted to note that I am on alert.
And, yes, the Federal Reserve could spurn this welcome mat and spoil the party, but such an act would go against the Fed’s typical behavior in the post-crisis world.
The volatility index, the VIX, is underlining and highlighting the welcome mat. It continues to slide sharply along a downtrend line. One little nudge by the Fed could plunge the VIX right back into the range that was comfortably churning for months before August.
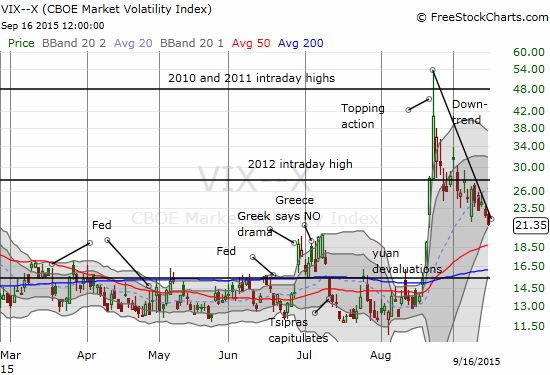
The volatility index, the VIX, continues to tumble ahead of Fedageddon
Accordingly, ProShares Ultra VIX Short-Term Futures (NYSE:UVXY) continued its hurtle back to earth. UVXY lost 12.2% on the day and continues to confirm its readiness to return to the typical misery of its longstanding downtrend. I am definitely regretting closing out my last tranche of UVXY put options at the open of the previous day! That is a LOT of profit I left on the table.

ProShares Ultra VIX Short-Term Futures (UVXY) is streaking downard toward its 50DMA
If the bears have any fight left in them, I expect them to try to hold the line at UVXY’s 50DMA. Maybe even engineer a final bounce.
The welcome mat is even showing up in emerging markets.
The iShares MSCI Emerging Markets ETF (NYSE:EEM) has broken out to a one-month high. I am of course looking back and marveling at how I decided to hold onto my put options as one of my remaining short positions and on-going hedge after the flash crash. Now, those puts are likely to end life at zero this Friday, and my EEM call options are going to soon double in value (readers recall that I like to set up call/put option combinations on EEM, a strategy called a strangle). I am going to do my best to hold onto those calls (expiration in October).

iShares MSCI Emerging Markets (EEM) breaks out and reaches toward 50DMA resistance
The iShares MSCI South Korea Capped (NYSE:EWY) is a play I am still holding from the first oversold period. This is about as bullish a breakout from a low as I could want. The primary downtrends from the 20DMA and now 50DMA are over.

iShares MSCI South Korea Capped (EWY) breaks out in a move that appears to confirm a bottom
Finally, interest rates are on the rise again. My call spread on the iShares 20+ Year Treasury Bond ETF (NYSE:TLT) looked brilliant for a hot minute during the flash crash. Like the EEM put options, I decided to hang onto the position as a hedge on all the bullish trades I was making to take advantage of the oversold period. Unless the Fed does something really extreme, my call spread will expire worthless.
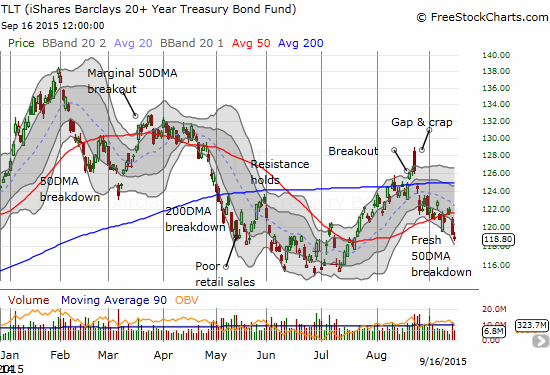
Is it finally time to short and STAY short TLT?
Time to stop writing and time to start buckling up!!!
Daily T2108 vs the S&P 500")
Black line: T2108 (measured on the right); Green line: S&P 500 (for comparative purposes)
Red line: T2108 Overbought (70%); Blue line: T2108 Oversold (20%)
Weekly T2108
Be careful out there!
Full disclosure: long SVXY shares, long SSO shares, long TLT put spread, long EWY calls, long EEM calls and puts