The “wealth gap” in the United States is widening. It’s a fact we’re reminded of almost every day...
On the web... in the news... and, increasingly, as part of campaign speeches. Economic inequality is the media’s topic du jour.
According to the noise, things are getting more unequal all the time. In fact, one survey found the gap between the richest and poorest Americans widened even as the U.S. economic recovery gained traction.
The question is: Will it stay that way?
Considering more than 50% of Americans aren’t currently invested in stocks, the answer is yes.
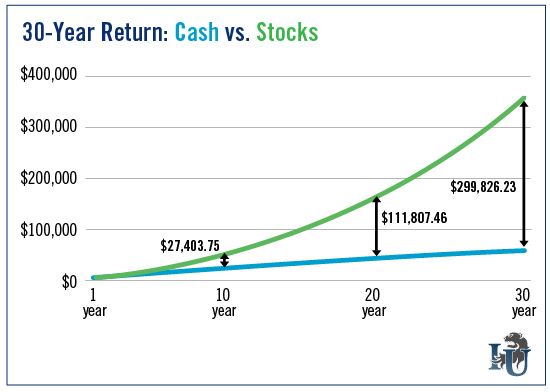
This week’s chart looks at how the return on cash would have fared against the return in the stock market over a 30-year period. It illustrates the point that investing is your key to building enduring wealth.
And contrary to popular belief, you don’t have to start out rich to get there.
The average worker under the age of 35 has just $6,000 saved. So to create our chart, we used this as our starting point. We also considered the fact that the median household income in the U.S. is $51,939.
Based on these figures, if you were to stash 6% of your income each year under a mattress or in a zero-interest savings account - accounting for inflation - you would end up with $60,825.26 worth of buying power at the end of three decades.
That may not sound bad. But in reality you lost money. Because over that 30-year period, you actually saved $99,490.20. Unfortunately, inflation ate $38,664 of it for lunch.
Since, historically, inflation has reduced purchasing power by 3.22% every year, one thing should be clear: Staying in cash is no way to build a nest egg. (And even if you parked your money in a savings account, right now the average annual percentage yield is a paltry 0.09%.)
It’s this sort of math and the flat-out refusal by half the nation to invest that keeps the poor... poor.
But what if you started with those same figures... and invested in the stock market instead?
The S&P 500 has averaged an annual return of 7% over the last 30 years. At that rate, you’d have $360,651.49 at the end of three decades.
That’s a 493% difference between stashing your cash under the mattress and investing in stocks.
Now, which sounds better to you?
As our Chief Investment Strategist Alexander Green recently wrote, “nothing exacerbates economic inequality like successful investing.”
What few seem to realize is that they can choose which end of the gap they’re on.
