Get 40% Off
🤯 Perficient is up a mind-blowing 53%. Our ProPicks AI saw the buying opportunity in March.Read full update

The R2K's In A Technical Jam

Published 09/17/2014, 03:28 PM
Updated 07/09/2023, 06:31 AM

Year-to-date, the Russell 2000 has lagged the S&P 500 by almost 8%, a fairly wide divergence. That disparity has a few investors concerned it may be a sign of weakness to come in the broad markets. But an interesting technical development highlights an important near-term intersection of time and price.

The chart below takes a technical perspective of how bulls and bears may be looking at small caps. And perhaps that's why they've endured so much volatility this year.
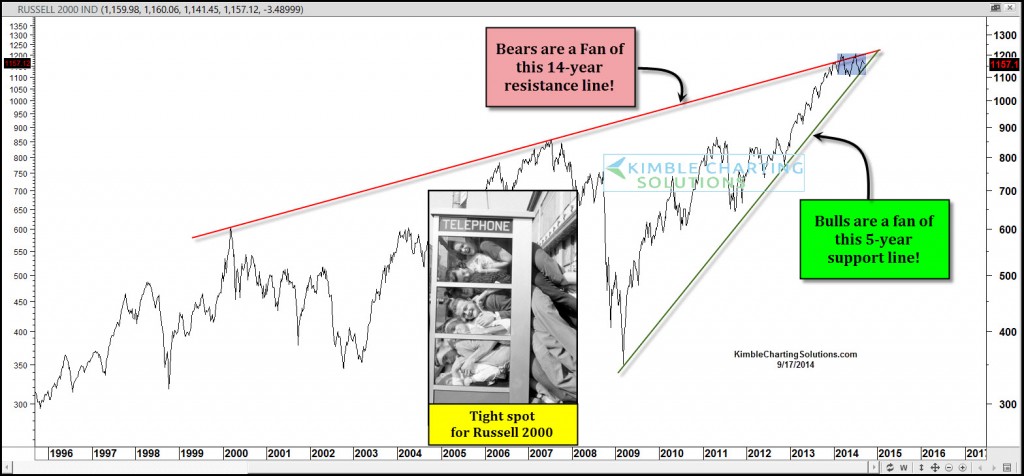
The Russell 2000: Long-Term Support/Resistance

  • Bears like this: Back in early March the Russell 2000 came upon a 14-year resistance line. Since then, the Russell is down 3%, while the S&P is up almost 8%.
  • Bulls like this: 6 weeks ago small caps hit a rising 5-year support line and have moved higher since, moving in sync with the broad market.

As you can see, these two support/resistance lines seem to have impacted small caps over the past few months as they have mostly chopped back and forth between these lines.

The bottom line, here, is that the Russell 2000 is in a tight technical jam that looks like it will resolve soon. Whether you are bullish or bearish small caps, an interesting technical intersection awaits the small caps.

And it could pay to follow the coming breakout/breakdown.

Latest comments

Risk Disclosure: Trading in financial instruments and/or cryptocurrencies involves high risks including the risk of losing some, or all, of your investment amount, and may not be suitable for all investors. Prices of cryptocurrencies are extremely volatile and may be affected by external factors such as financial, regulatory or political events. Trading on margin increases the financial risks.
Before deciding to trade in financial instrument or cryptocurrencies you should be fully informed of the risks and costs associated with trading the financial markets, carefully consider your investment objectives, level of experience, and risk appetite, and seek professional advice where needed.
Fusion Media would like to remind you that the data contained in this website is not necessarily real-time nor accurate. The data and prices on the website are not necessarily provided by any market or exchange, but may be provided by market makers, and so prices may not be accurate and may differ from the actual price at any given market, meaning prices are indicative and not appropriate for trading purposes. Fusion Media and any provider of the data contained in this website will not accept liability for any loss or damage as a result of your trading, or your reliance on the information contained within this website.
It is prohibited to use, store, reproduce, display, modify, transmit or distribute the data contained in this website without the explicit prior written permission of Fusion Media and/or the data provider. All intellectual property rights are reserved by the providers and/or the exchange providing the data contained in this website.
Fusion Media may be compensated by the advertisers that appear on the website, based on your interaction with the advertisements or advertisers.
© 2007-2024 - Fusion Media Limited. All Rights Reserved.