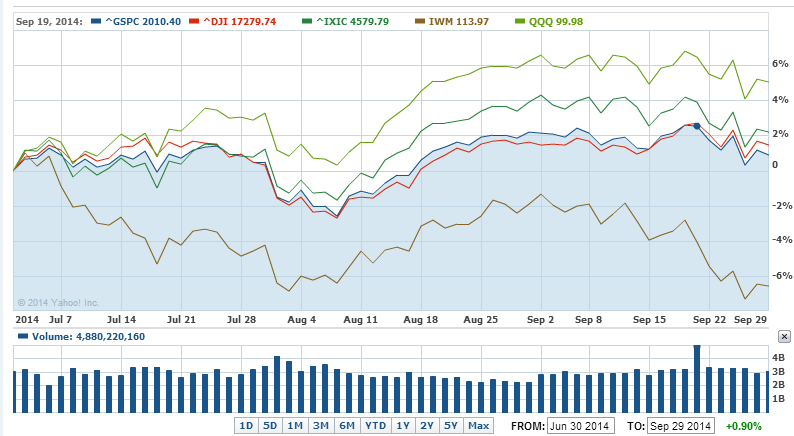
The third quarter ended with all the major indices RUT, DJIA, SPX the NASDAQ and the PowerShares (NASDAQ:QQQ) down for the month of September.
Here Are The Stats:
- -(ARCA:IWM) -6.19% for the month, down -7.97% for the quarter, the weakness here which explains the horrible breadth while the DOW and the SP500 hung near highs fooling the home-gamers.
- -The Dow Jones was down -.03% for the month and up 1.39% for the quarter.
- -Nasdaq Composite was down -1.89% for the month but up 1.92% for the quarter.
- -SP500 was down -1.5% for the month but up .60% for the quarter.
- -QQQ was down -.96% for the month but up 5.29% for the quarter.
Breadth has been horrible for the last couple of months and its getting worse, it will be interesting to see how this plays out since we are entering what historically is the best quarter of the year.
These charts that start at the beginning of the third quarter gives you a better picture of what transpired in the last 3 months.
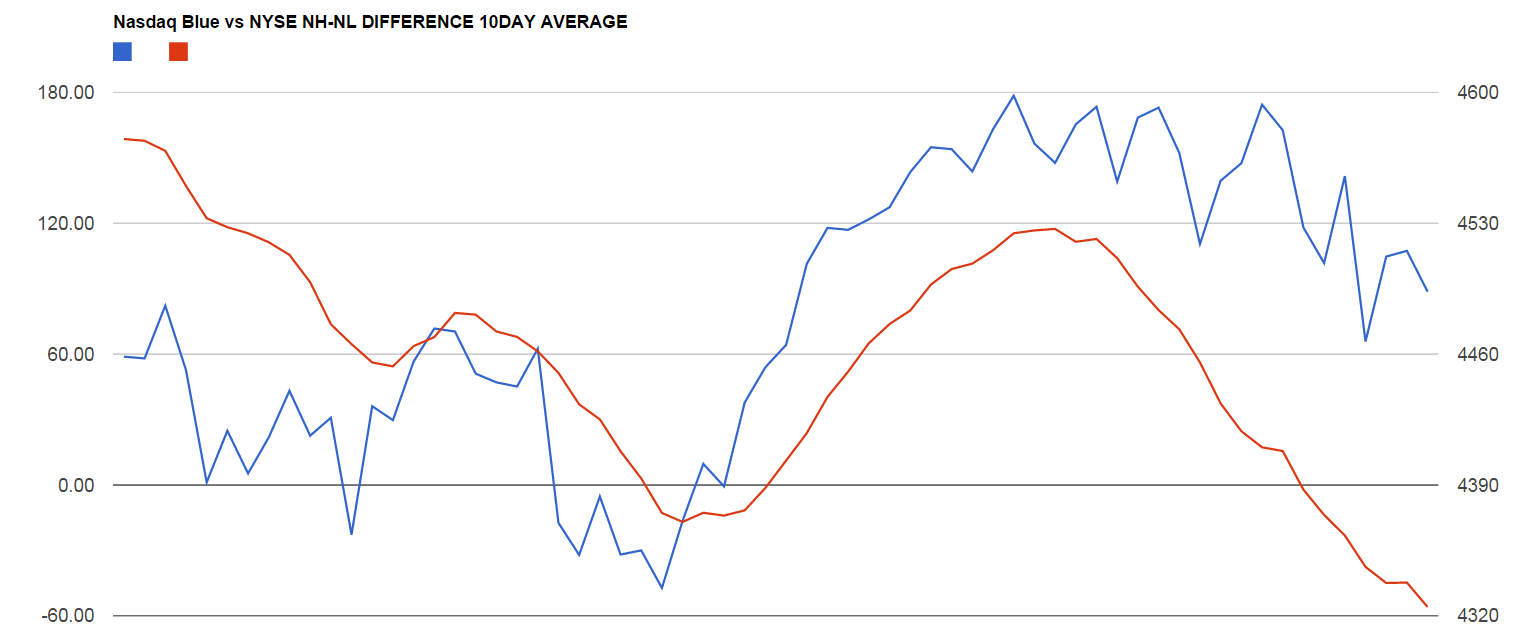
NASDAQ vs NYSE New Highs – New Lows Difference 10-day moving average.
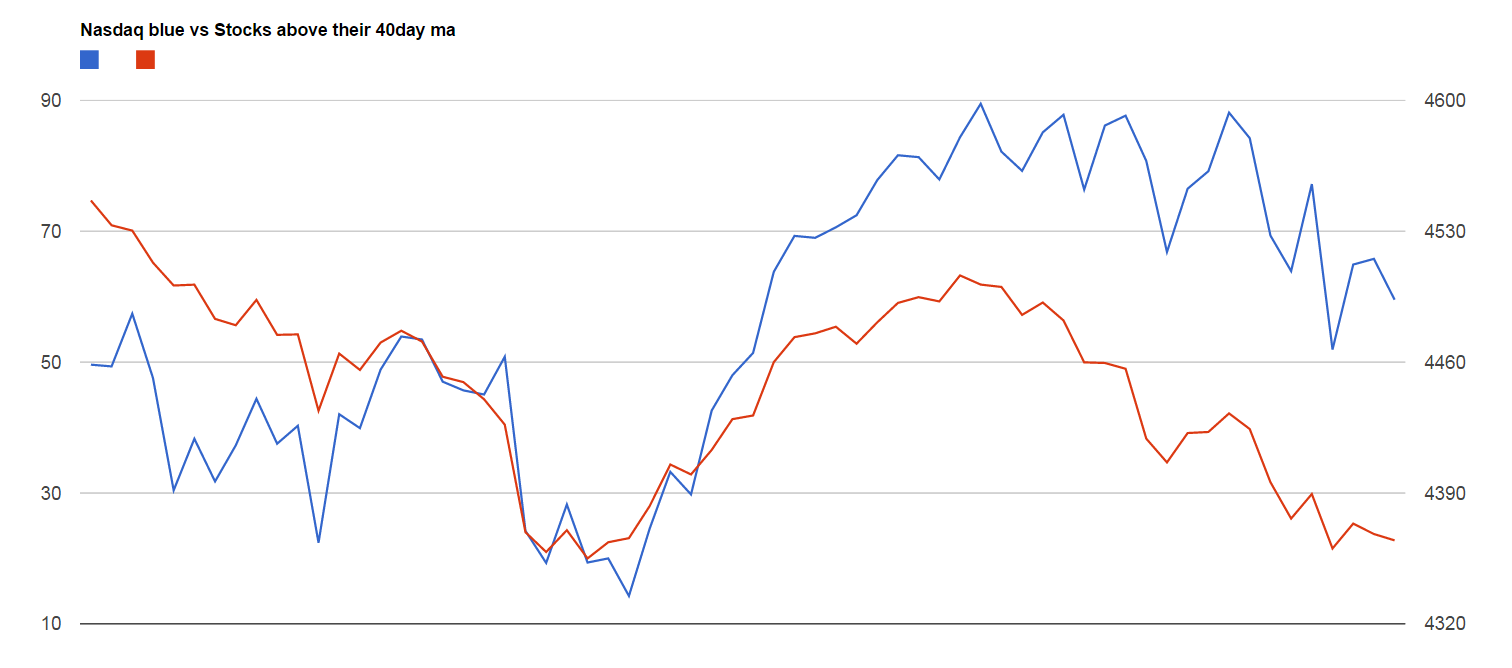
Nasdaq vs All stocks above their 40-day moving average
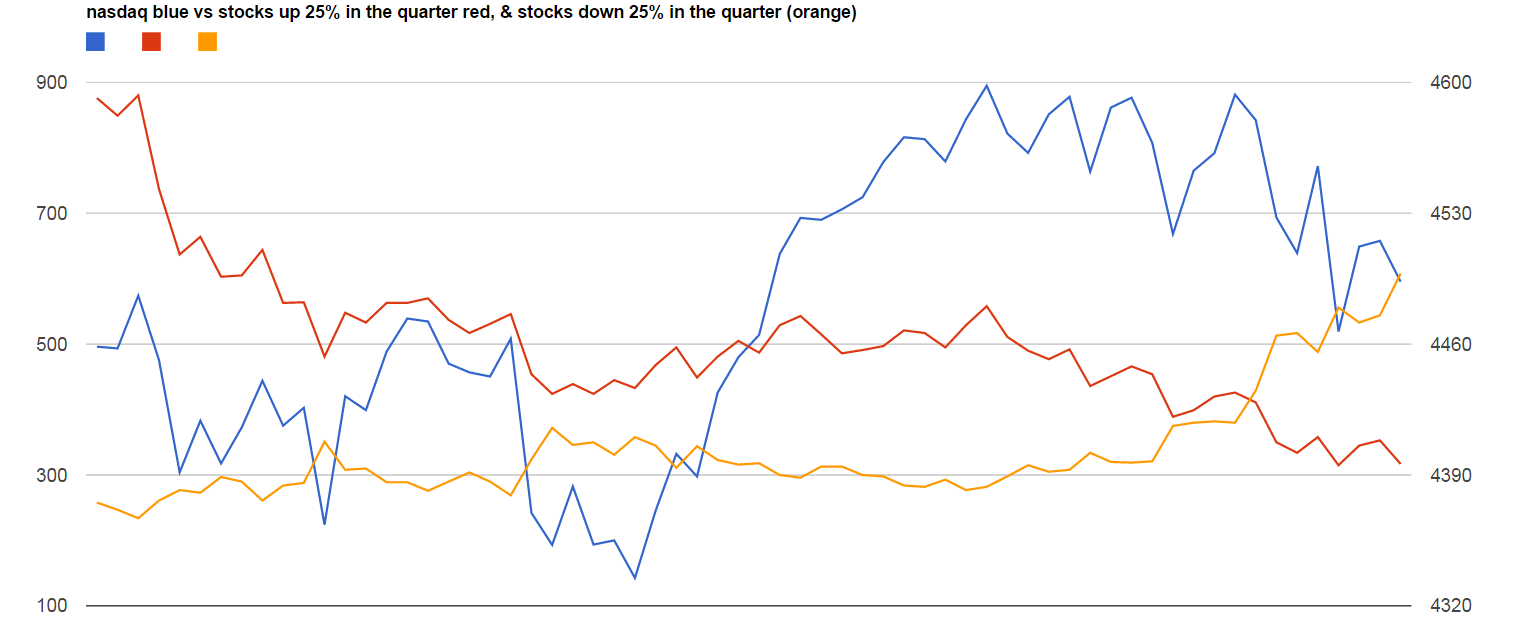
Nasdaq vs Stocks up 25% for the quarter and Stocks down 25% for the quarter.
Here’s a recap of those charts;
- -We are now seeing more new lows than new highs, this has been the case for the last 7 days on the NYSE.
- -The percent amount of stocks above their 40 day moving average peaked a month ago, while the nasdaq when sideways for a month the stocks underneath were deteriorating.
- -The amount of stocks up 25% for the quarter also peaked a month before the nasdaq saw any selling, currently we have 317 stocks up for the quarter versus 608 that are down 25% for the quarter, ht Pradeep Bonde.
More Stats:
- -1,560 stocks out of 1960 in the Russell 2000 stocks were down for the quarter, that’s 79% that ended lower for the quarter.
- -2,238 stocks out 2,980 in the Russell 3000 were down for the quarter, in other words 75% were lower from their 6/30/13 close.
- -We now have 37% of the Russell 3000 stocks down 20% or more from their 52 week highs.
- -48% of the Russell 2000 stocks are down 20% or more from their 52 week highs.
Many active traders probably got chopped around in this mess trying to make something happen when they was really nothing to do (swing trading perspective), less was better.
Here is the Fidelity Contrafund (large cap) versus the Fidelity otc stock fund and the Fidelity low price fund. Clearly a select few large caps was the place to be this quarter.
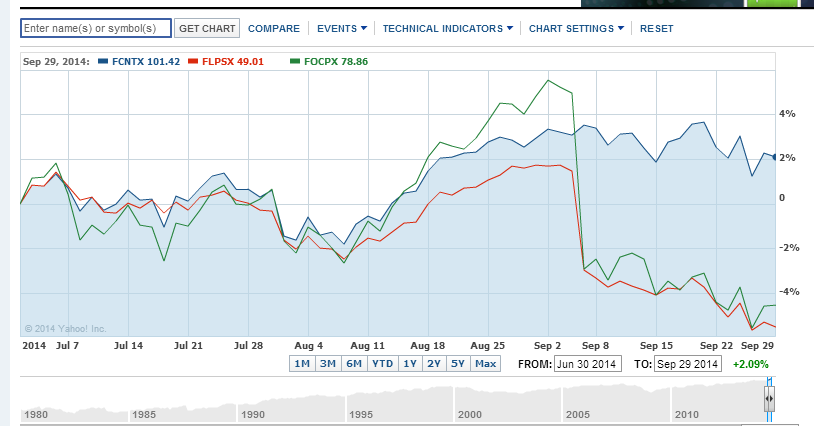
Very simply all I’m doing is pointing out what happened in the third quarter. I’m not predicting what is going to happen based on these stats, but when you get your monthly statement and you scratch your head and say what the hell happened, now you know.
Frank Zorrilla is the founder of Zor Capital LLC a New York based investment management firm. Our goal is superior performance, with preservation of capital as our number one priority. Zor Capital manages separate accounts (both taxable and retirement) for accredited investors and institutions. This structure gives clients access to a hedge fund like strategy while maintaining 100% control of their accounts.
The information in this blog post represents my own opinions and does not contain a recommendation for any particular security or investment. I or my affiliates may hold positions or other interests in securities mentioned in the Blog, please see my Disclaimer page for my full disclaimer.
