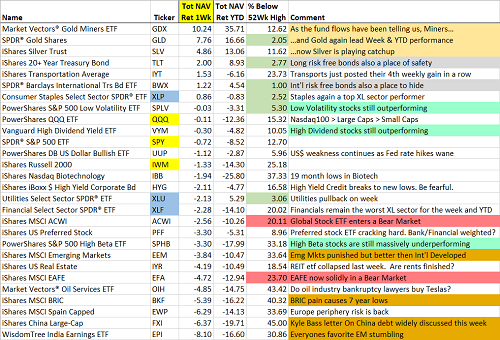
Another violent week in the markets as each asset class had some security making a two standard deviation move. Oil, yen, Bank Credits and plenty of Equity groups were bobbing in the winter surf last week. Oil and Credit continued to be the main thermometers of the Equity markets while Yellen spent her time on the Hill answering questions about negative interest rates. OPEC meetings were the daily rumor and when they did occur, the market remained just as confused. Late last week interventions everywhere helped the markets find a low: Japan in the yen, China in the yuan, Deutsche Bank (N:DB) in their Debt and Jamie Dimon in JPM (N:JPM). But Kanye is still waiting for the Zuckerberg call.
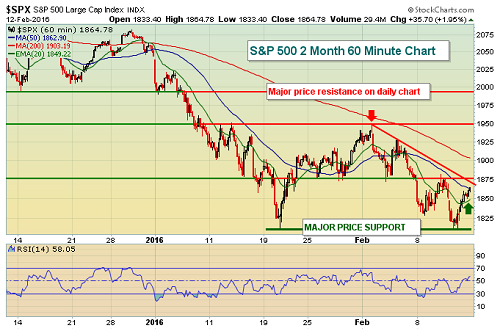
If you needed an hourly chart to summarize the consensus opinion on Friday, this is a good one. Basically, the majority of equity investors are hoping that the lows have been set but also realize that there is plenty of either technical or fundamental valuation resistance just above…
Here is a glance at the major U.S. indexes along with the worst and best performing major ETFs since the Fed lifted rates in December. Eye opening moves…
Since the Fed raised the benchmark Fed Funds rate by 25 basis points on December 16th, $8 trillion in global equity market cap has vanished. That equates to 12% of global stock market capitalization wiped out, bringing total world market cap down to $56 trillion from its level of $64 trillion on December 16th.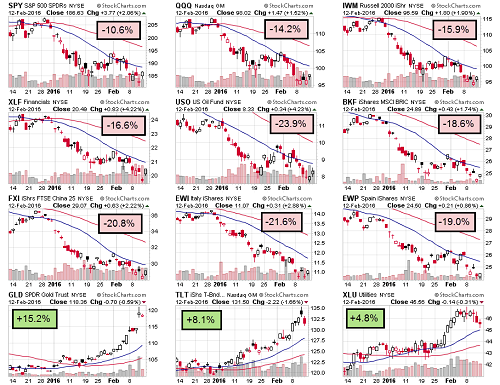
Looking at last week, only Staples managed a positive return. Financials and Utilities were the bottom performers…
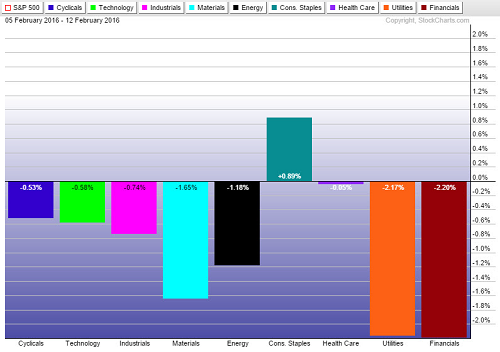
More broadly, Safety again led this week just as it did last week. International Equities again posted a rough week…
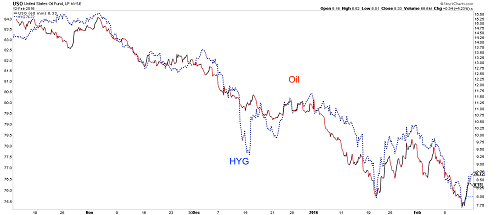
Will Junk Bonds ever disconnect from Energy prices? They couldn’t be more closely correlated over the last four months…
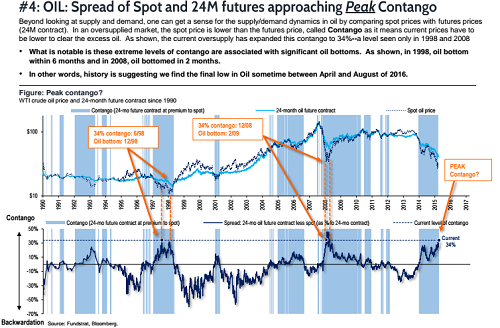
The world is running out of places to store liquid energy. This will eventually bring an end to further production…
BP (L:BP) is planning for oil prices to stay low for the first six months of the year and expects surplus production to only start diminishing when storage tanks fill up in the second half.
“We are very bearish for the first half of the year,” Chief Executive Officer Robert Dudley said at the IP Week conference in London Wednesday. “In the second half, every tank and swimming pool in the world is going to fill and fundamentals are going to kick in. The market will start balancing in the second half of this year.”
The Saudis held a mini OPEC meeting with Russia early Tuesday to discuss U.S. swimming pools filled with crude oil. But an agreement to freeze production is dependent on others joining the party. So a turning point, or just more hollow words?
“The reason we agreed to a potential freeze of production is simply the beginning of a process to asses in the next few months and decide whether we need other steps to stabilize the market,” Ali Naimi said after meeting the Russian, Qatari and Venezuelan oil ministers in Doha. “We want a stable oil price.”
The production freeze, set at January levels, is conditional on other nation’s agreeing to participate, Russia’s Energy Ministry said in a statement after the meeting ended. The deal doesn’t yet include Iran and Iraq, two OPEC members that have increased output in recent months.
@matthewmreed: How different are these comments by the #UAE #oil minister, really? The latter is what got markets excited.
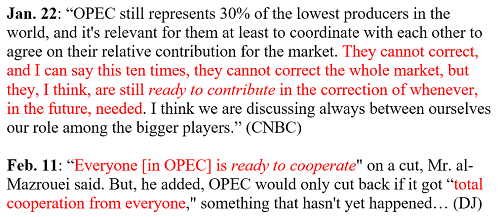
If OPEC really wanted to move oil prices, they should just buy Mercedes-Benz and give every driver on Earth a G-Wagon…

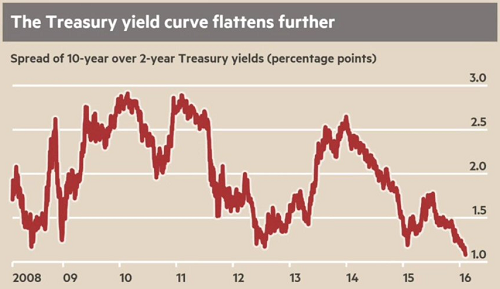
The shape of the U.S. Yield Curve is getting lots of attention…
The most accurate financial market predictor of recession is starting to blink more ominously in the US.
The “yield curve” — the slope made up of the yields of Treasury bonds of various maturities — is a popular gauge for the health of economies, and historically the most accurate market gauge for a recession. While the stock market has a patchy record of predicting economic downturns, the US yield curve has “inverted”, when short-term borrowing costs are higher than longer term ones, ahead of every recession since the second world war.
The yield curve is still far from inverting, but the difference between the 2 and 10-year Treasury yield, a popular measure of its shape, on Wednesday slipped just below 100 basis points (or 1 percentage point) for the first time since January 2 2008.
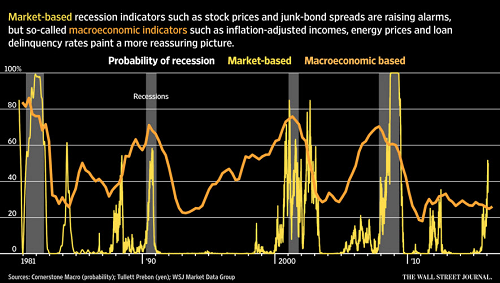
A bit more on the potential for a recession as seen in the crystal ball of the financial markets…
This dichotomy is neatly captured by two indexes compiled by Cornerstone Macro. One, using financial indicators such as the stock market and corporate bond yields, puts the probability the U.S. is now in recession at 50%. The other, which adds in macroeconomic data such as loan delinquencies and inflation-adjusted income, puts the probability at just 28%.
Of course markets often wrongly predict recessions. But in some circumstances they can help bring them about. Economic turning points are unpredictable because they are caused by changes in psychology, not just mechanical factors such as interest rates and wages and salaries. Markets influence that psychology by signaling to businesses whether they should invest or hire. Fear of recession can thus be self-fulfilling.
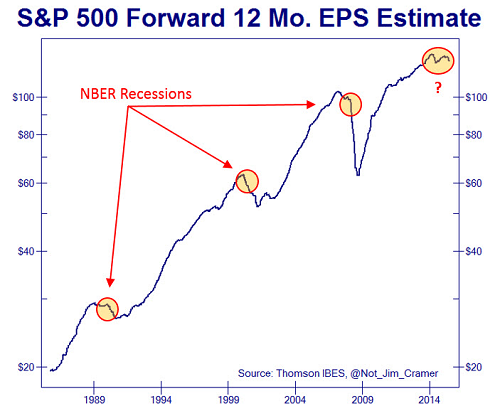
Equally important to pay attention to is the slowdown in Corporate Earnings…
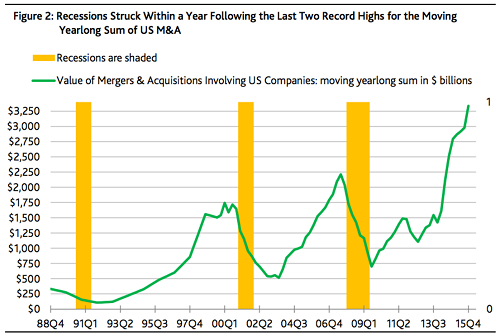
It is no coincidence that the decline in credit and stocks have led to a big slowdown of M&A in 2016…
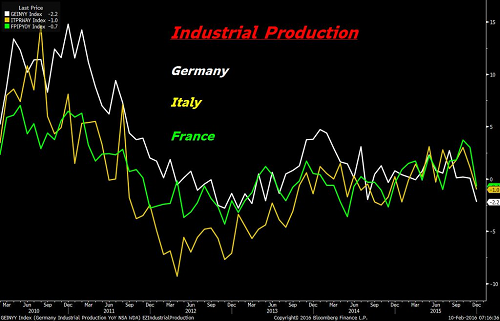
Meanwhile, the economic data out of Europe gets much more difficult…
@TheStalwart: These are not good industrial production numbers released this week.
As the World’s Central Banks increasingly rely on Negative Interest Rate policies to fight economic weakness, JPMorgan has some thoughts…

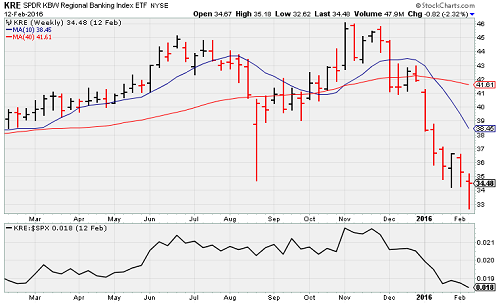
Janet Yellen spoke to Congress last week and reiterated her belief that the Fed is still on track to move rates higher…
Yellen said the Fed’s intention in December, when it raised its benchmark federal funds rate for the first time in nearly a decade, was to “gradually, gradually continue to raise rates — not to cut them.”
“A lot has happened since then,” she said. “But I have not thought that a downturn sufficient to cause the next move to be a cut was a likely possibility, and we’ve not yet seen, I would say, a shift in the economic outlook that’s sufficient to make that highly likely.”
However, the financial markets continue to place bets against the Fed…
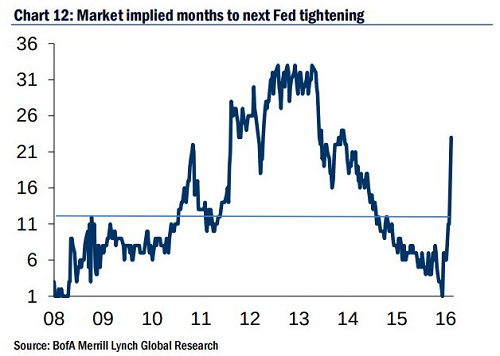
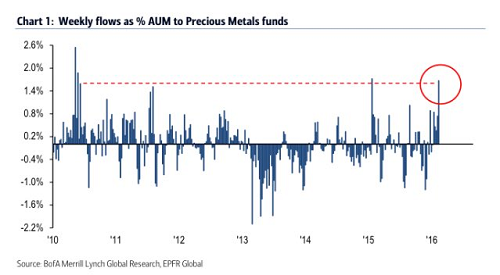
One asset class that is finding Valentine’s love in 2016 is gold…
@bySamRo: Second largest weekly inflow into precious metals in six years. BAML is calling it a “gold rush”
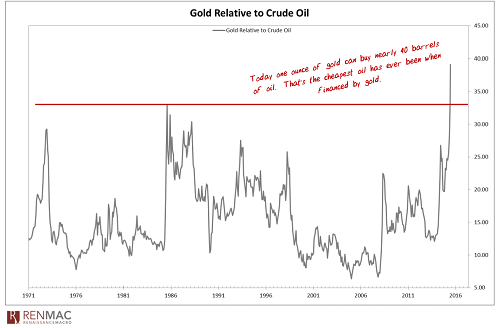
Now comparing gold to oil, here is a great chart…
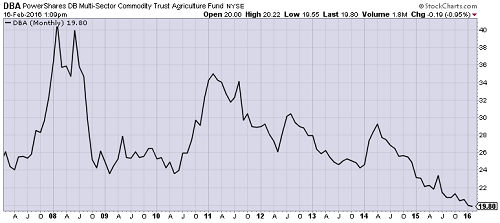
Onto other commodities, if you have direct exposure to rural or agricultural economies, you might want to review your positions…
@Tyne_Ag: USDA thinks we’ll see the lowest farm income since 2002 this yr. That’s off 56% from the high in 2013..brutal!
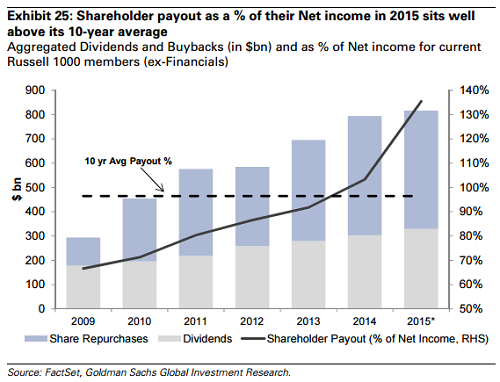
I have always been a fan of dividends and stock buybacks, but this chart suggests that maybe companies have taken it too far…
In each of the last seven years, shareholder payout has gone up, both in terms of absolute dollar value as well as relative to earnings and cash flow. So much so that in 2015, corporate America returned way beyond its means – the payout ratio (as measured by buybacks and dividends as a % of Net Income) spiked to 135% – 40 percentage points above its 10-year average (Exhibit 25). We note that dividend payouts (standalone) for 2015 came in at 55% vs. the 10-year average of slightly in excess of 35%.
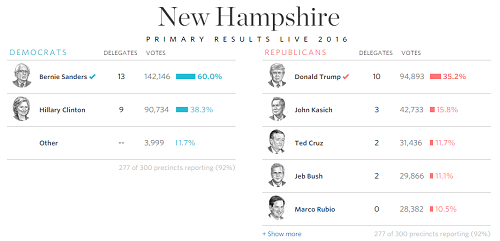
The New Hampshire Primary was last week. Some thoughts from Jared Dillian that could be pressuring the markets…
You don’t get two bigger command-and control guys than Bernie and Trump. Bad for markets. Bad for trade. Bad for everything. Pretend I am a portfolio manager in Geneva and I own a bunch of U.S. stocks. I’m watching what’s going on…I sell everything. For the same reason you sell Turkey today or Argentina back in 2002. These things happen in slow motion. You can see it coming. If I’m in Geneva and I calculate a 20-30% chance of President Sanders and a 30-40% chance of President Trump, I am not going to stick around and see what happens. I hit the Mad Money sell button. Sell sell sell.
(WSJ)
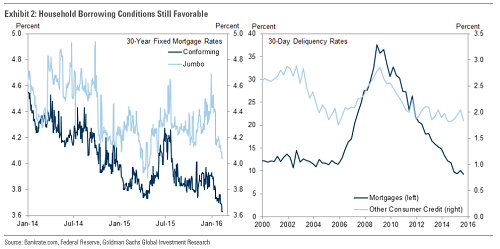
Some good news for consumers as rates return to lows…cheap mortgages.
Disclaimer: The information presented here is for informational purposes only, and this document is not to be construed as an offer to sell, or the solicitation of an offer to buy, securities. Some investments are not suitable for all investors, and there can be no assurance that any investment strategy will be successful. The hyperlinks included in this message provide direct access to other Internet resources, including Web sites. While we believe this information to be from reliable sources, 361 Capital is not responsible for the accuracy or content of information contained in these sites. Although we make every effort to ensure these links are accurate, up to date and relevant, we cannot take responsibility for pages maintained by external providers. The views expressed by these external providers on their own Web pages or on external sites they link to are not necessarily those of 361 Capital.

