Get 40% Off
👀 👁 🧿 All eyes on Biogen, up +4,56% after posting earnings. Our AI picked it in March 2024.
Which stocks will surge next?
Unlock AI-picked Stocks

The Oil To Bonds Ratio Is Confirming A 6 Year Double Bottom

Published 03/04/2015, 07:42 AM
Updated 05/14/2017, 06:45 AM

You have to be dead to not know that oil fell hard over the back half of 2014. It was all over the news. You saw it at the pump. It was not so visible the rise in bond prices unless you follow that sort of thing.

But it is equally as interesting that not one economist had predicted that bonds would rise in 2014. These moves in themselves for Crude Oil and Treasury Bond prices were incredible. But when looked at together, a really spectacular phenomenon shows up.
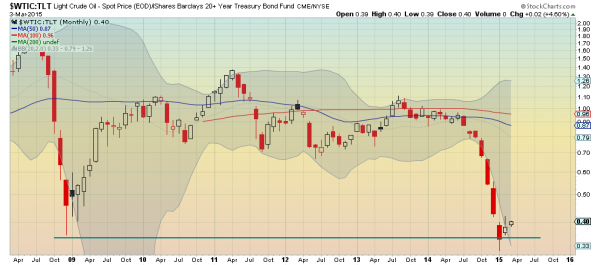
Oil Vs. TLT Monthly Chart

The chart above shows the ratio of Crude Oil to the Treasury Bond ETF (ARCA:TLT). Two things stand out. The first is the fast spike down at the height of the financial crisis in 2008. It recovered from that fairly quickly and settled into a consolidation zone. The relationship between the two was constant. For 4 years. Then the second spike down occurred. What is interesting about it form a technical perspective is that the second spike ended at the same place as the first spike. A possible double bottom. February saw an inside month or Harami in Japanese Candlestick vernacular.

And although it is early in March, the ratio is following through to the upside. Confirmation at month end would be best, but this price action sets up a mean reversion trade back to the 50 month SMA and the prior sideways action. You can trade this best by being long Crude Oil against short Treasuries, but it also gives you a possible indication of a bias higher in Crude and lower in Treasuries.

3rd party Ad. Not an offer or recommendation by Investing.com. See disclosure here or remove ads .

Disclaimer: The information in this blog post represents my own opinions and does not contain a recommendation for any particular security or investment. I or my affiliates may hold positions or other interests in securities mentioned in the Blog, please see my Disclaimer page for my full disclaimer.

Original post

Latest comments

Risk Disclosure: Trading in financial instruments and/or cryptocurrencies involves high risks including the risk of losing some, or all, of your investment amount, and may not be suitable for all investors. Prices of cryptocurrencies are extremely volatile and may be affected by external factors such as financial, regulatory or political events. Trading on margin increases the financial risks.
Before deciding to trade in financial instrument or cryptocurrencies you should be fully informed of the risks and costs associated with trading the financial markets, carefully consider your investment objectives, level of experience, and risk appetite, and seek professional advice where needed.
Fusion Media would like to remind you that the data contained in this website is not necessarily real-time nor accurate. The data and prices on the website are not necessarily provided by any market or exchange, but may be provided by market makers, and so prices may not be accurate and may differ from the actual price at any given market, meaning prices are indicative and not appropriate for trading purposes. Fusion Media and any provider of the data contained in this website will not accept liability for any loss or damage as a result of your trading, or your reliance on the information contained within this website.
It is prohibited to use, store, reproduce, display, modify, transmit or distribute the data contained in this website without the explicit prior written permission of Fusion Media and/or the data provider. All intellectual property rights are reserved by the providers and/or the exchange providing the data contained in this website.
Fusion Media may be compensated by the advertisers that appear on the website, based on your interaction with the advertisements or advertisers.
© 2007-2024 - Fusion Media Limited. All Rights Reserved.