Summary- The general backdrop for investing remains positive: the markets are rallying and the economy is growing.
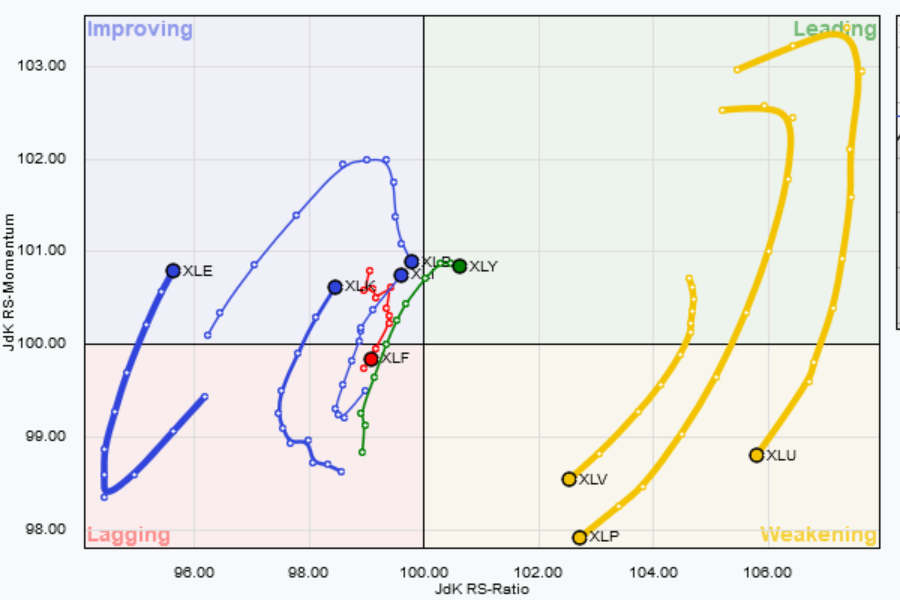
- The sector backdrop is shifting: defensive sectors are "lagging" the market, although several are rallying, only the consumer discretionary sector is "leading" the SPY.
- Four stocks are highlighted: Johnson & Johnson (NYSE:JNJ), Medtronic (NYSE:MDT), Microsoft (NASDAQ:MSFT), and Apple (NASDAQ:AAPL).
Investment thesis: while the general economic backdrop remains positive, investors should be aware of the weakness in the leading and now coincidental indicators. The broader markets are still rallying. Although the health care sector is underperforming the SPY, the XLV ETF broke through resistance on Friday. Two stocks look attractive: Johnson and Johnson (JNJ) and Medtronic (MDT). The tech sector is "improving" relative to the SPY. Two stocks look attractive in this sector: Microsoft (MSFT) and Apple (AAPL).
The Momentum Investor Explained
The purpose of The Momentum Investor is to find companies that have sold off and are now rising. The universe for this column is limited to dividend “aristocrats” – stocks that have increased their dividends for 25 consecutive years – and the 10 largest holdings of the following sector ETFs: the NYSE:XLB, NYSE:XLE, NYSE:XLF, NYSE:XLI, NYSE:XLK,NYSE:XLP, NYSE:XLU, NYSE:XLV, NYSE:XLY, NYSE:VNQ. All of these are large, well-established companies whose importance to the market creates a natural bid for their respective shares.
This column is at the mercy of the market. If the market is in a severe correction, it’s unlikely any of the companies will be attractive. Conversely, if the market is rallying strongly, it’s possible that a large number of companies fit the general criteria. In that event, I will exercise editorial discretion as to how many companies are covered.
Company analysis focuses on the financial statements in the following order: cash flow, balance sheet, and income statement. I use Morningstar for all financial statement data. Because the universe of stocks contains large companies, revenue growth probably won’t be that impressive. What’s important is the amount of cash each company generates along with the strength of its balance sheet. Because most of these companies are large, well-established, multi-national companies, the most reasonable expectation is for revenue growth equal to GDP growth; anything faster is icing on the cake.
The General Economic And Market Backdrop
Momentum plays are more likely to succeed when the economy is growing and the markets are rising. The economic backdrop is moderately concerning. I have a 25% recession probability in the next 6-12 months. This is not fatal but should be included in the overall investment analysis. The general market backdrop is positive. Please see my regular Technically Speaking column for a deeper analysis of the markets.
The Sector Backdrop
Defensive sectors are weakening relative to the SPY. But remember -- this doesn't mean they're falling; it could mean (as it does here) that these sectors are moving higher to a smaller degree than the broader market. Consumer discretionary (in green) is the only sector leading the market. Industrials and basic materials are right on the cusp of leading the market while financials (in red) are lagging.
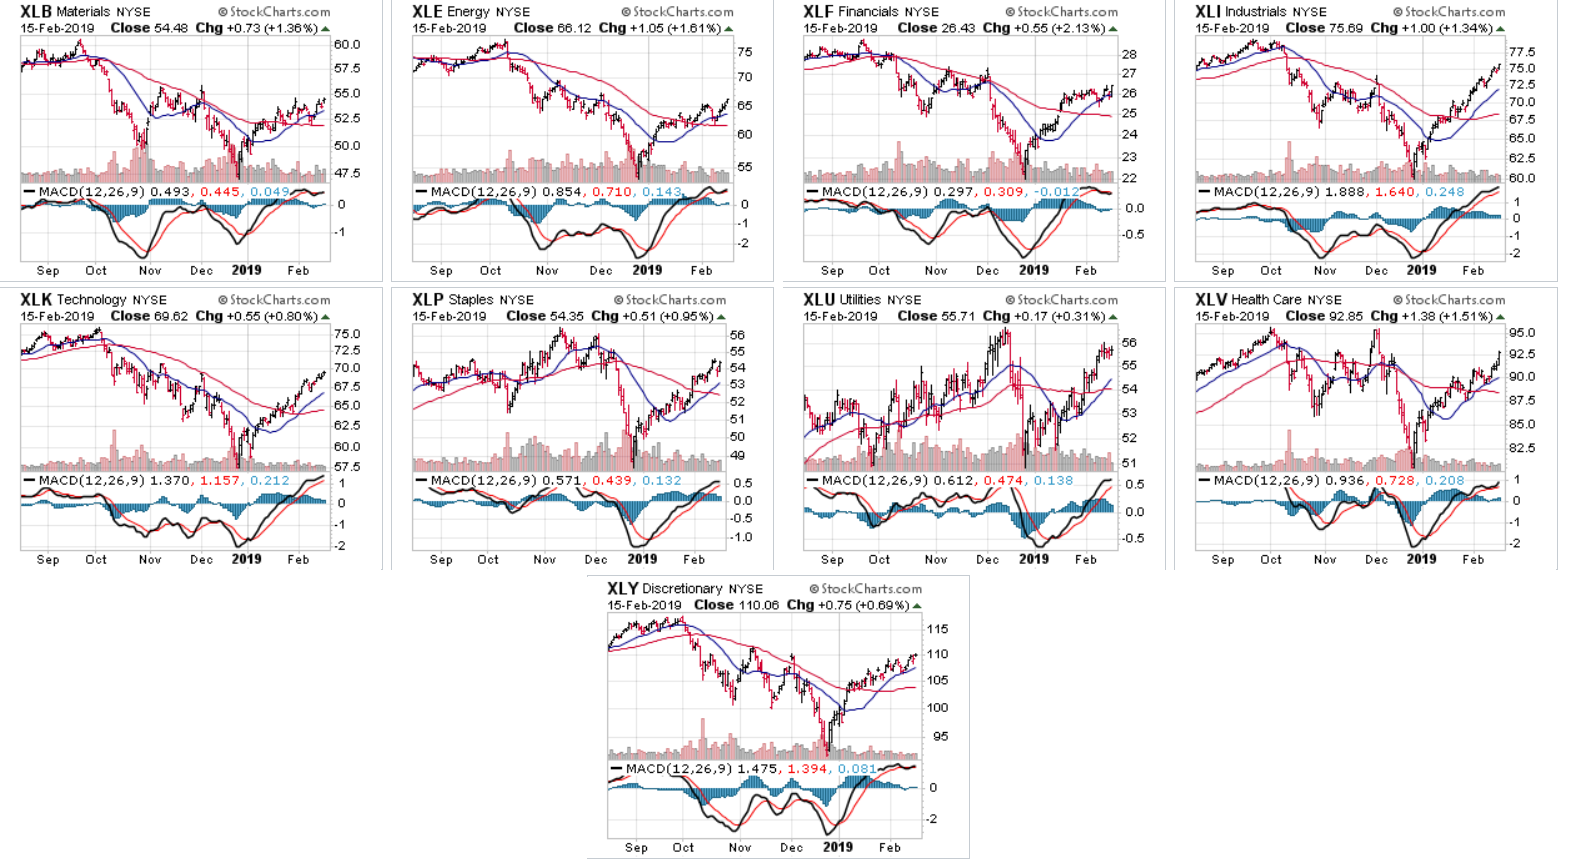
Let's next look at the 6-month charts of all the sectors:
Let's begin by noting the rallies that look a bit tired. Industrials (top row, far right) and utilities (middle rose, second from right) look a bit stretched. Both are near previous highs with higher readings on the MACD. Energy (top row, second from left) has more upside room on the chart; the MACD is a potential yellow flag. Staples (middle row, second from left) is right on the cusp of being tired; it's also lagging the SPY. However, remember that we're nearing the end of an expansion when staples typically outperform the market. The same observations apply to the XLV.
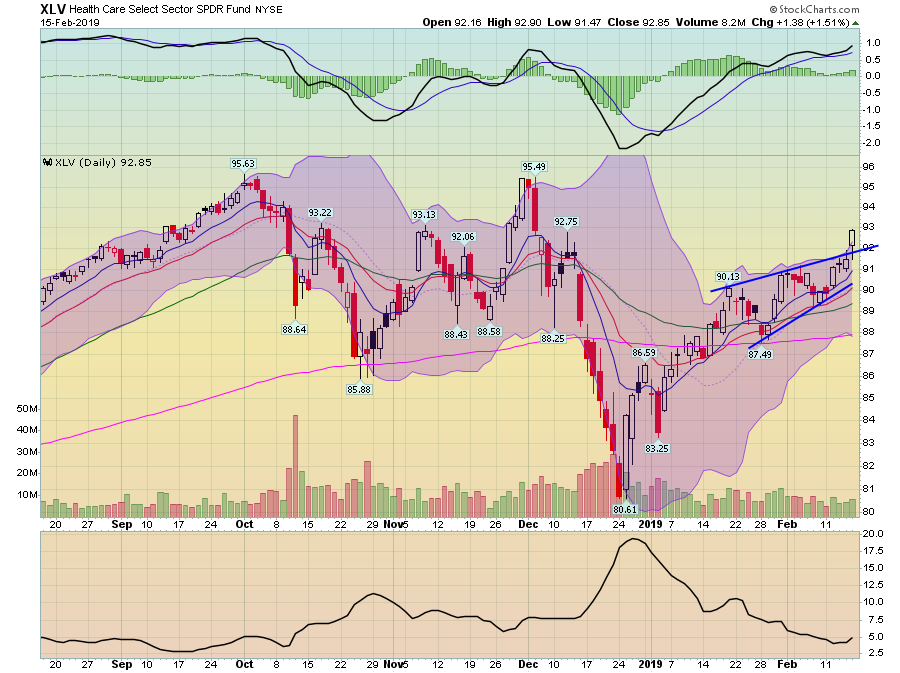
Let's now move into the stocks in focus, starting with the healthcare sector. Although the RRG chart above says this sector is "lagging," the chart is very attractive.
The sector fell with the broader market at the end of last year but has since rallied slightly more than 15%. The EMAs are bullishly aligned; the shorter are above the longer and all are rising, as is momentum. Most importantly, prices broke out to the upside on Friday. There are two companies on my watch list in this sector that look attractive.
Johnson and Johnson (JNJ)
According to finviz.com, JNJ is the largest "major" drug company with a market value of $365 billion. Out of 24 companies in the industry, they have the fifth highest current and forward PE, making them one of the most expensive companies. But over half of the companies in this sector have no earnings. They are a dividend aristocrat, having raised their dividend each of the last 56 years. The company is currently yielding 2.64%, which means it's paying slightly less then 10-year Treasury.
The company has a strong cash flow statement. For the last five years, income and depreciation alone are usually sufficient to fund the company's investments. They are very shareholder friendly; over the last five years, they have repurchased $31.2 billion in stock and paid $40.7 billion in dividends. The company's debt position is enviable: its debt/asset ratio is 20%.
There are three key pieces of information in their latest 10-Q. First, the company took a charge of $13 billion due to the TCJA. This substantially lowered net income for the latest fiscal year. Second, the company is in the middle of a restructuring. Third, there are a number of lawsuits moving through the courts related to their baby powder product.
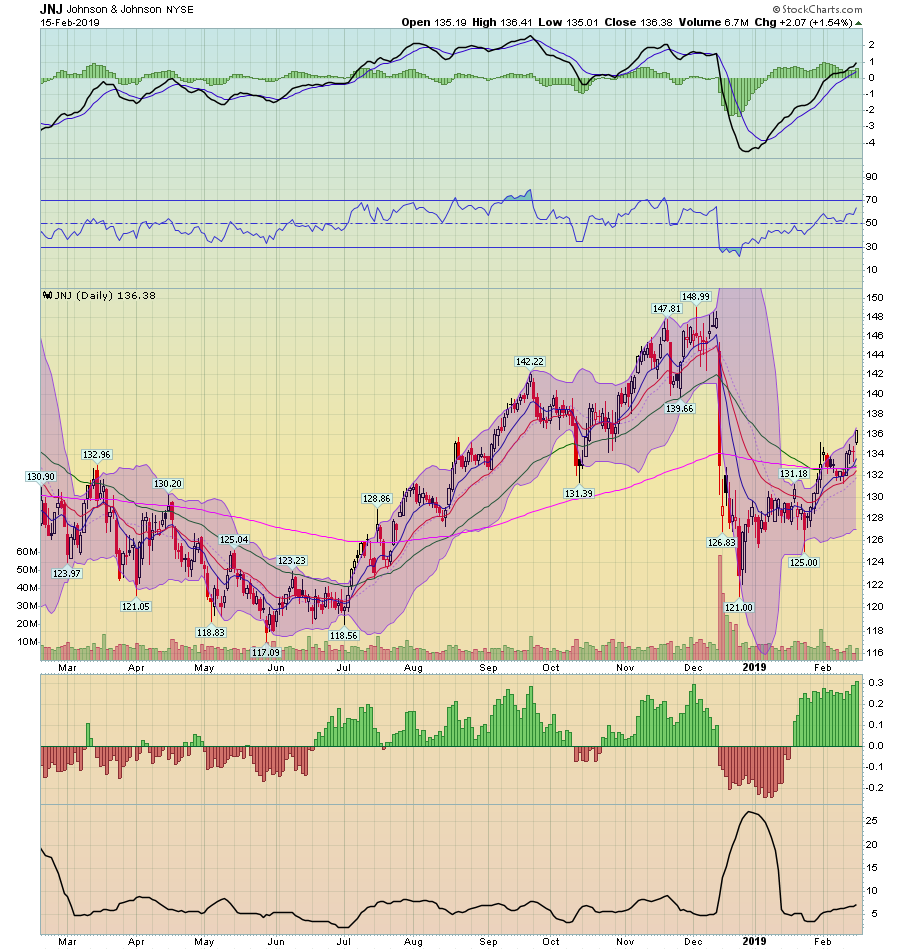
Not only has the health care sector broken through resistance, JNJ stock -- which is one of the 10-largest members of the XLV ETF -- is in a solid uptrend:
The stock dropped 9.5% when they lost one of the first cases related to their baby powder; the stock dropped an additional 4.6% during the next few weeks. Since then, it has rallied about 12%. Prices are now above the 200-day EMA. All the shorter EMAs are rising, as is momentum. There's an additional 10% room to run on this chart before it hits highs from last year.
Medtronic (MDT)
According to Finviz.com, Medtronic is the second largest company in the medical device industry; the company's market value is $124 billion. Out of 77 companies, it has the 16th highest PE and 24th highest forward PE. They are a dividend aristocrat, having raised their dividend for the last 41 years.
The company has an interesting cash flow statement. Its income + depreciation is usually sufficient to fund property investments and net acquisitions. But the company also actively manages an investment portfolio. According to the latest 10-Q, the company has $6.2 billion in available for sale securities on its balance sheet. This results in untraditional activity in the investment portion of their cash flow statement. The company is shareholder friendly; they have repurchased $13 billion in stock and paid out $9.4 billion in dividends over the last 5 years. Its debt/asset ratio is a very conservative 26%.
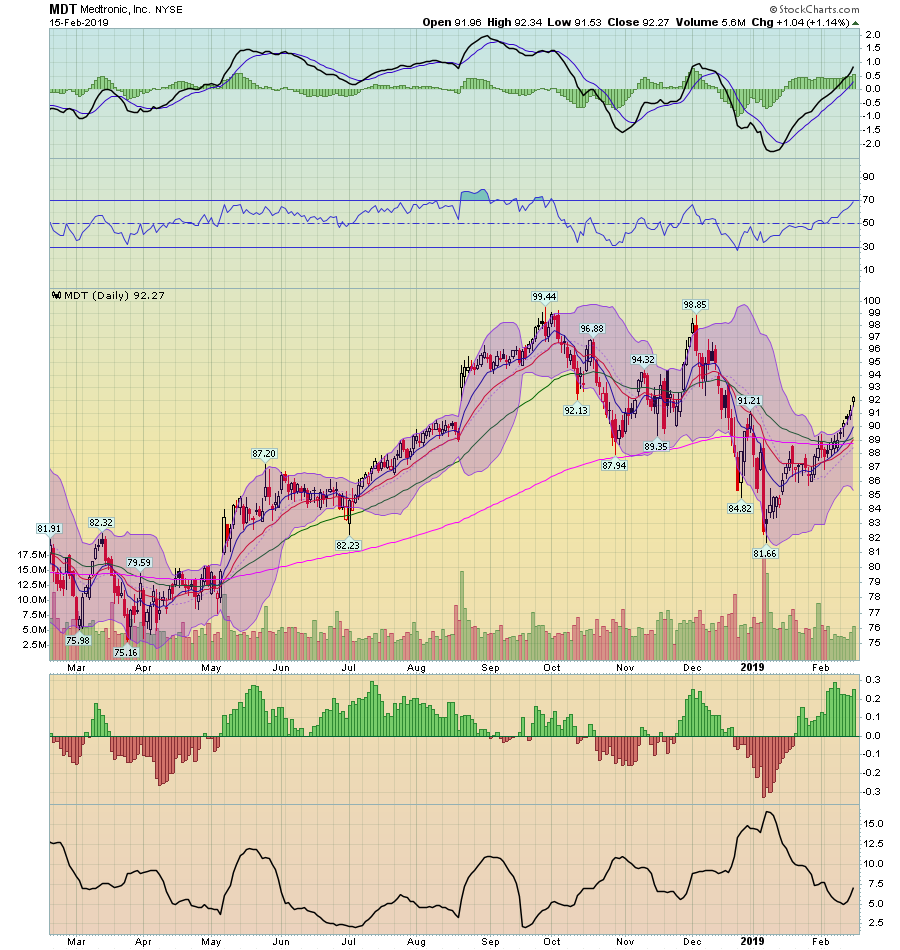
Like JNJ, MDT is not only a dividend aristocrat but one of the 10 largest members of the XLV ETF. It has a very attractive chart:
The stock only dropped 11% in the market swoon at the end of last year. Since the end of December, prices have rallied 12.7%. Prices are currently above the 200-day EMA. The 10 and 20-day EMA have crossed over the 200-day EMA; the 50 never fell below it. Momentum is strong.
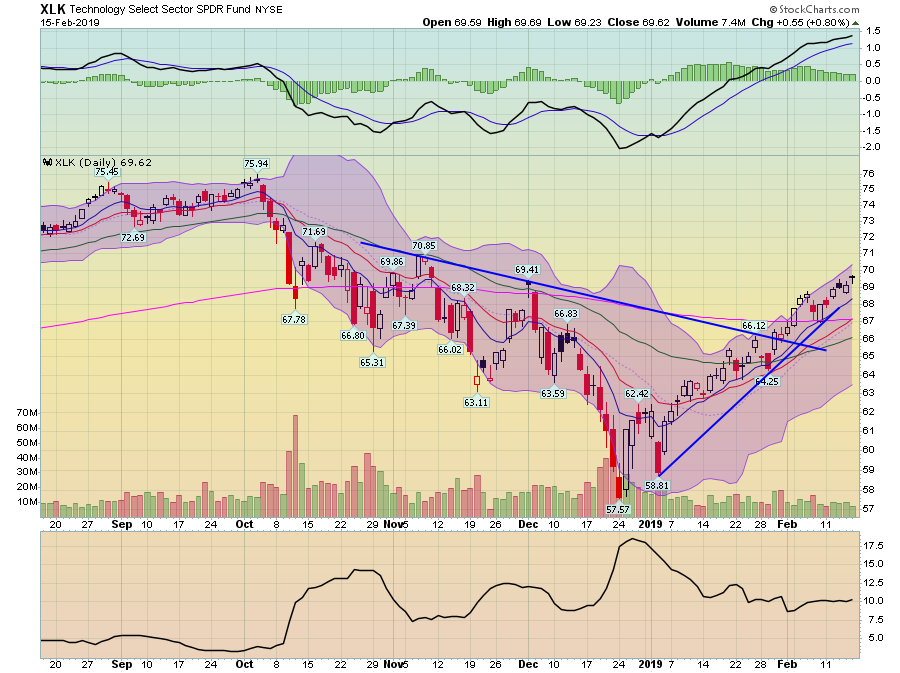
Next, let's move to the tech sector, starting with a look at the XLK:
The XLK is in a solid uptrend. The ETF sold off with the market at the end of last year, falling 24%. It has since rallied 21%. Prices are above the 200-day EMA. The 10-day EMA has already crossed above the 200; the 20-day will early this week. Momentum is rising. According to the RRG chart above, it is "improving" relative to the SPY.
Microsoft (MSFT)
MSFT is the largest business software company -- by far. Its market value is $827 billion; ADP (NASDAQ:ADP) -- with a market value of $65.2 billion -- is the second largest. MSFT is the 8th cheapest stock in the sector (current PE of 25); its forward PE is 21.67, making MSFT the 18th cheapest stock. The company has a modest 1.7% dividend yield, which is the fifth highest in the industry. (the information in this paragraph is derived from Finviz.com).
The company has tremendous cash flow. Over the last five years, the smallest amount of Graham and Dodd Cash Flow (net income + depreciation) was $18.150 billion, which is more than enough to cover the company's property investment needs (which have risen from $5 to $14 billion). In the last five years, the company's smallest EBITDA was $25.2 billion. Their cash + short term investment position has increased from $85 billion in 2014 to $133 billion in the last annual report. Any way you look at the company, cash is everywhere.
The company is very shareholder friendly. Since 2014, the company has repurchased $60 billion in stock and paid $54.3 billion in dividends.
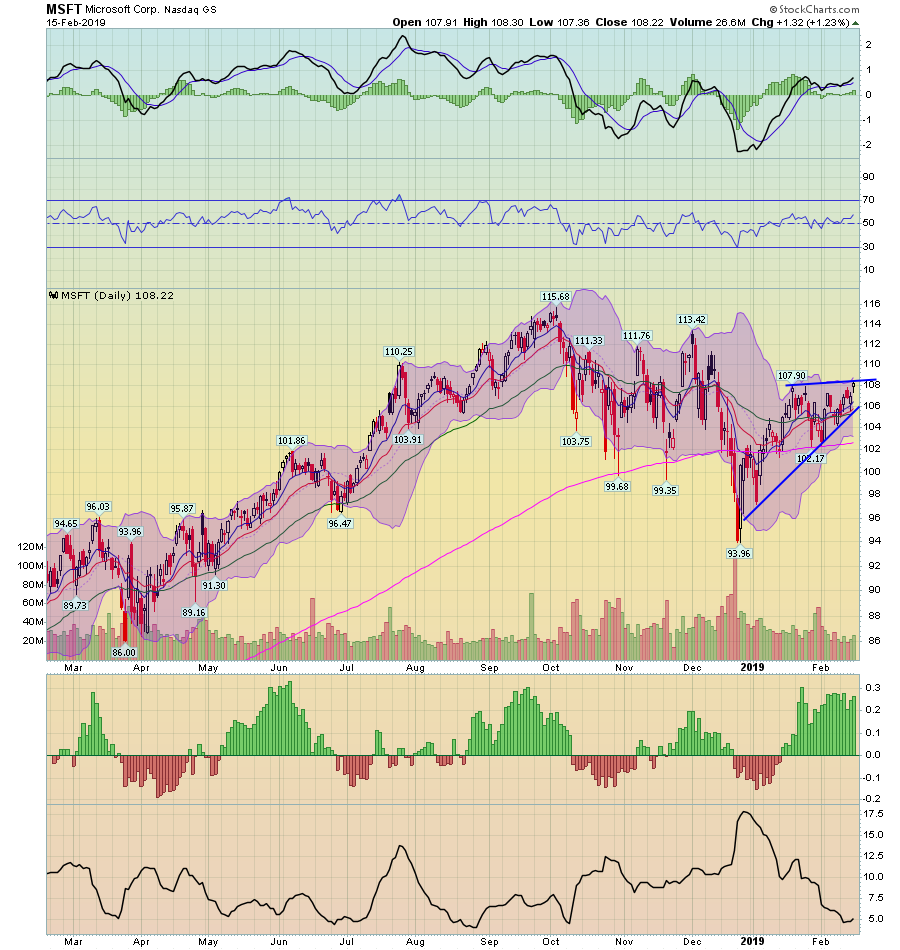
MSFT is one of the 10 largest members of the XLK ETF. Its chart is technically attractive:
The company sold off with the broader market at the end of last year, falling from an absolute high of 115.68 to 93.96, for a 19% decline. Prices have since rallied about 15% and are now consolidating recent gains above the 200-day EMA. The shorter EMAs are also providing technical support. The MACD has given a buy signal and has room to move higher before hitting previous highs.
Apple (AAPL)
Apple is one of the most valuable companies in the world with an $805 billion market capitalization. Of the 14 companies in the electronic equipment sector, it has the 4th lowest PE (14.28) and the 5th cheapest forward PE (13.38). It has the third highest dividend, which is a modest 1.71%. (Finviz.com provided the data for this paragraph).
Apple is a cash register. In 2014, they had total cash of $25 billion; by 2018, that number increased to $66 billion - a 2.6x increase. According to their cash flow statement, the smallest amount of Graham and Dodd Cash Flow (net income + depreciation) the company has had over the last five years is $47 billion; over the same time, the company's smallest amount of property investment was $13.3 billion. As if that weren't enough, since 2014, their smallest EBITDA total was $61.8 billion.
The company defines "shareholder friendly." Since 2014, they have repurchased $215 billion in stock and paid out $26 billion in dividends. My only quibble with the company is that I'd like to see those numbers reversed.
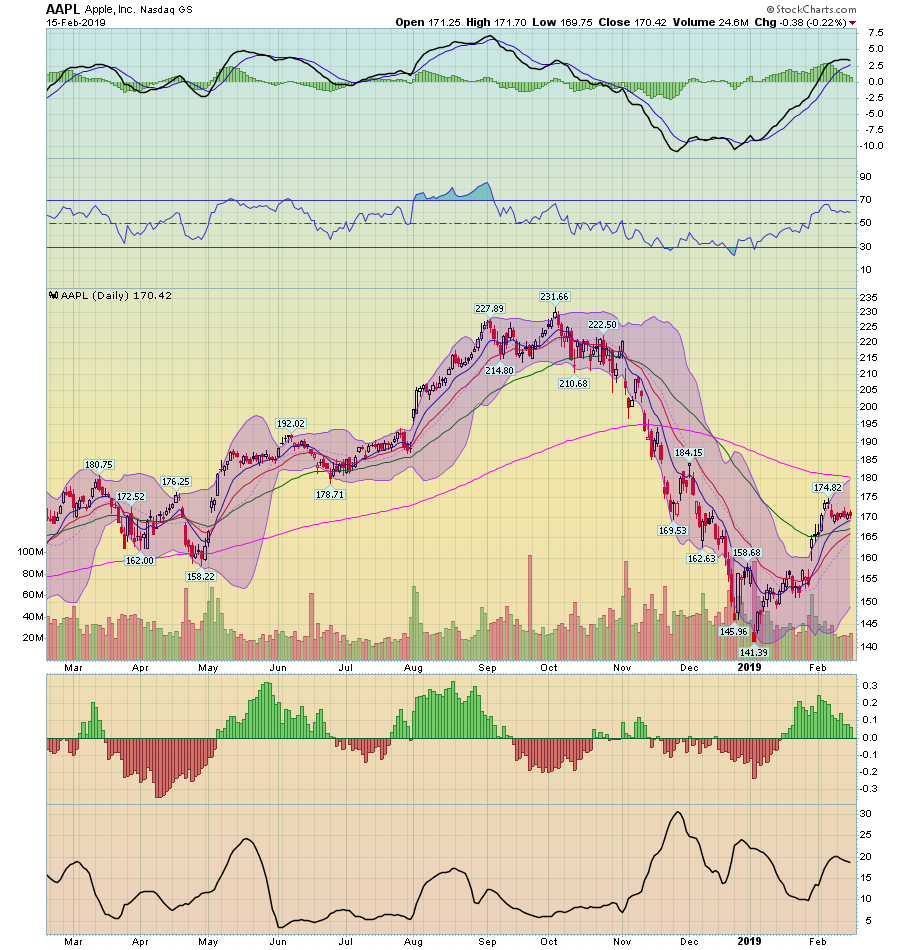
The stock is technically attractive:
Apple sold off with the broader market last year, falling nearly 40%. It has since rallied about 20%. Prices are consolidating recent gains between the 50 and 200-day EMA. The 10-day EMA has moved through the 50-day EMA; the 20 will follow soon. Momentum is rising.
I hope you find this column helpful and informative.
I don’t have a professional relationship with any reader, nor should this column be considered specific investment advice for any individual. Please do your own homework to make sure the investments discussed are within your individual risk tolerance.
Disclosure: I am/we are long jnj, mdt, msft. I wrote this article myself, and it expresses my own opinions. I am not receiving compensation for it (other than from Seeking Alpha). I have no business relationship with any company whose stock is mentioned in this article.

