Monitoring purposes Gold: Gold ETF GLD long at 173.59 on 9/21/11.
Long Term Trend monitor purposes: Flat

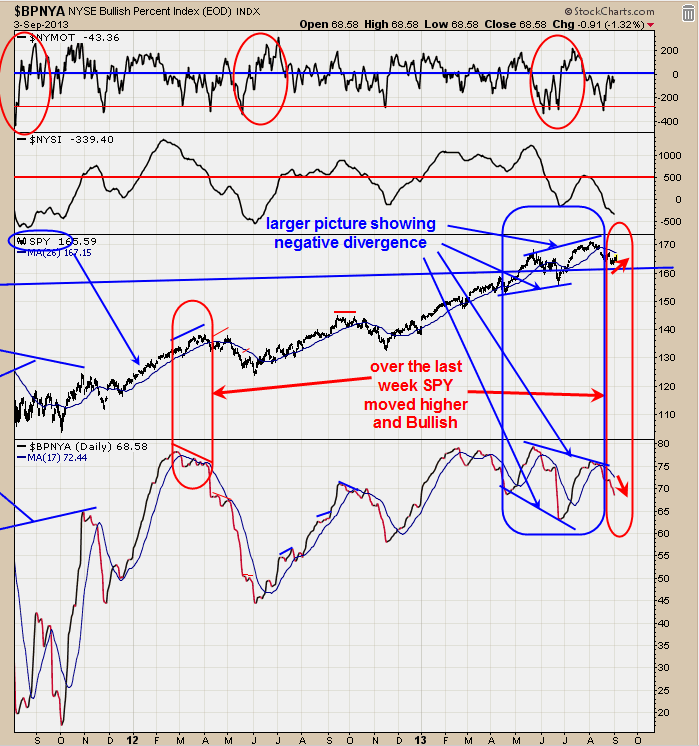
The bottom window is the NYSE Bullish Percent index. The bullish Percent index measures the percent of buy signals in the NYSE that are on Point and Figure buy signals. Currently there are 68.58% of stocks in the NYSE that are on point and Figure buy signals and dropping. Over the last several days the SPY has moved higher and the Bullish Percent index moved lower and not a good sign longer term. One would like to see the opposite of that in that the SPY was dropping and the Bullish Percent index was rising. In regards to the current situation, once the current bounce is completed in the SPY, the Bullish Percent index suggests the market will turn back down. Also notice that in May and July the SPY made higher highs and the Bullish percent index made lower highs. Our scenario for the June 24 low near 1560 on the SPX is still on the table. We covered our short SPX yesterday for a 1.3% gain and are now neutral and will be looking for another sell signal. 
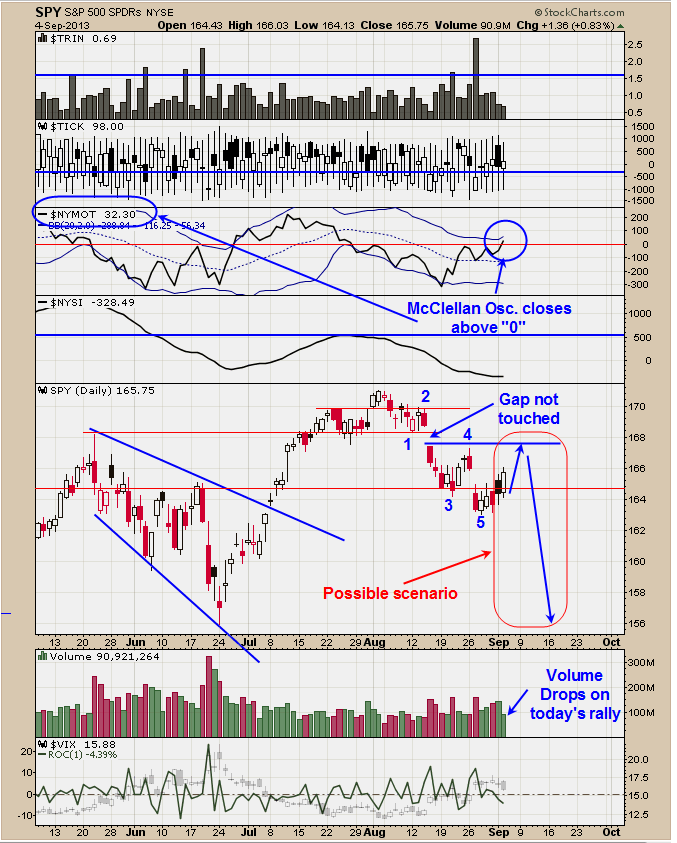
There was an Elliott wave five count down from the August high. What is going on now is a consolidation up. The 8/15 gap near 168 on the SPY was never touched and that may be where the SPY is going. Most gaps from our experience are tested at some point and would make sense since that is where the SPY is heading. If the 8/15 gap is tested on lighter volume than that would imply resistance and a setup for a potential sell signal. Today’s volume was light and showed there was weak demand on today’s rally and a bearish sign. Today’s McClellan Oscillator did close above “0” which in turn turned up the McClellan Summation index and a bullish short term sign. Market should find resistance near 168 on the SPY (1680 on SPX) where a potential sell signal could develop. For longer term we still expect the June 24 low near 1560 range will be tested later this month or early October.
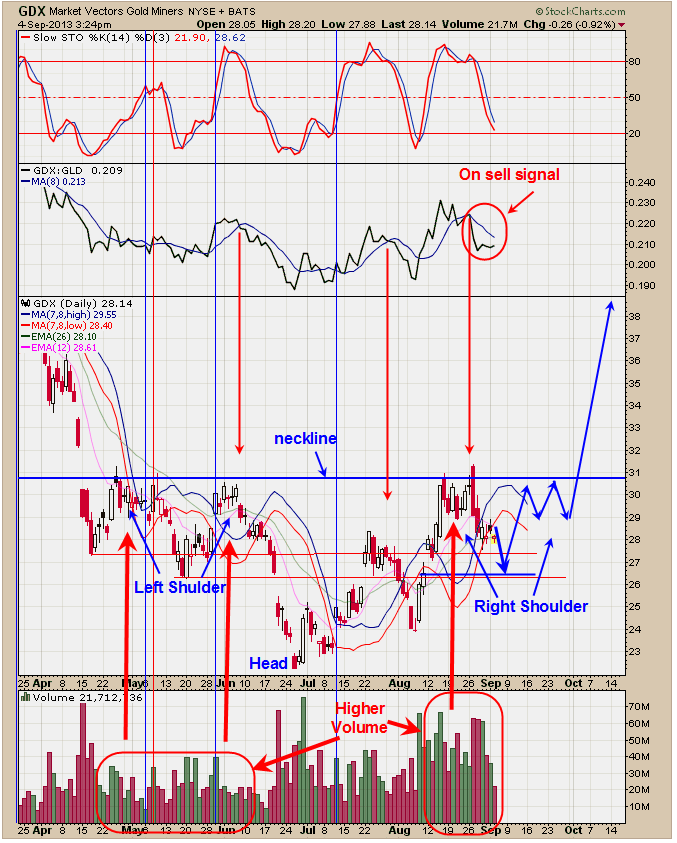
It appears a Head and Shoulders bottom forming where the Head is the June 26 low near 22. The Neckline comes in at 31. There is symmetry in Head and Shoulders patterns. If the Left Shoulder has two humps than the Right Shoulder should have two humps. We are counting last week high near 31 as the first Hump of the Right Shoulder. A pull back to gap support near 27 to 26 range and another rally up near 31 would produce a second hump and than after that the real breakout comes. The basing pattern has been going on since Mid April and creating “Cause” for the next big move. We will be watching the GDX/GLD ratio for positive divergences to help define the next low, which ideally be near gap support at 27 – 26 range. The whole pattern developing has a bullish tone in that the recent test of the 31 range came on higher volume then the test of April and May testing the 31 level and suggests the energy is stronger now pusher higher then the period back in April and May. We remain bullish but a trading range between 31 to 27 is likely before a breakout above 31. This potential Head and Shoulders bottom has a target near 40 range.
Long NG at 5.14 on 10/8/12. Long GDX at 58.65 on 12/6/11. Long GLD at 173.59 on 9/21/11. Long GDXJ average 29.75 on 4/27/12 Long BRD at 1.67 on 8/3/11. Long YNGFF .44 on 7/6/11. Long EGI at 2.16, on 6/30/11. Long KBX at 1.13 on 11/9/10. Long LODE at 2.85 on 1/21/11. Long UEXCF at 2.07 on 1/5/11. We will hold as our core position in AUQ, CDE and KGC because in the longer term view these issues will head much higher. Holding CDE (average long at 27.7. Long cryxf at 1.82 on 2/5/08. KGC long at 6.07. Long AUQ average of 8.25.
