In our daily lives, we use oxymorons on a regular basis. Combinations of words like "exact estimate," "pretty ugly--" and "butt head" are pretty funny when you think about them. Other combinations of words, such "business ethics," have become oxymorons given that major U.S. banks have effectively become criminal enterprises by being allowed to rig forex and LIBOR markets. Those criminal actions, which would have resulted in jail time for anyone else, resulted only in a small fine and a promise not to commit MORE criminal acts for 36 months. That should be sufficient time for the banks to plan their next major caper.
I digress. There is another emerging oxymoron: the "bearish bull market" in stocks.
Currently, there are things occurring that are very troublesome, and in more normal times, would likely already have investors heading for cover. However, in today's liquidity fueled, Central Bank supported environment, that has yet to be the case. The reason was best described recently by Dr. Robert Shiller:
"I call this the 'new normal' boom — it's a funny boom in asset prices because it's driven not by the usual exuberance but by an anxiety."
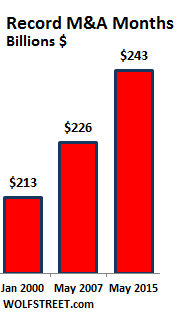
In other words, it is not exuberance about the strength of the economy, job security and global stability that is providing investors the confidence to plunge into markets. It is the "anxiety" of missing out on further gains. This anxiety has fueled by Central Banks which continue to create a liquidity driven environment. The excess liquidity has manifested itself in surging levels of subprime auto loans, student debt, corporate share repurchases, rising levels of margin debt and record levels of mergers and acquisitions. As an example of the latter, Wolf Richter wrote yesterday:
"Global growth is languishing, corporate revenues too, but CEOs are trying to show they can grow their companies the quick and easy way. Cheap debt is sloshing through the system while yield-hungry investors offer their first-born to earn 5%. And this cheap debt along with vertigo-inducing stock valuations have created the largest M&A boom the US has ever seen, with May setting an all-time record.
These deals are financed by a mix of shares, new debt, and cash raised with prior debt issuance – the “dry powder.” Much of this debt is in form of junk bonds and junk-rated leveraged loans, which banks then either sell to loan funds or craftily slice and dice and fabricate into highly-rated collateralized loan obligations (CLOs). Some of these CLOs are then put through the Wall Street sausage maker again to reemerge as triple-A rated bonds denominated in yen for the Japanese market.
Loading up overleveraged junk-rated companies with more debt – even if it’s cheap – has consequences down the road: US default rates are creeping up, hitting 2% in May, the highest in 17 months, according to S&P Capital IQ."
Think about that for a moment. There is a bit of historical precedent for the outcome of companies issuing junk debt that is repackaged and resold by Wall Street as AAA-rated securities. What could possibly go wrong this time?
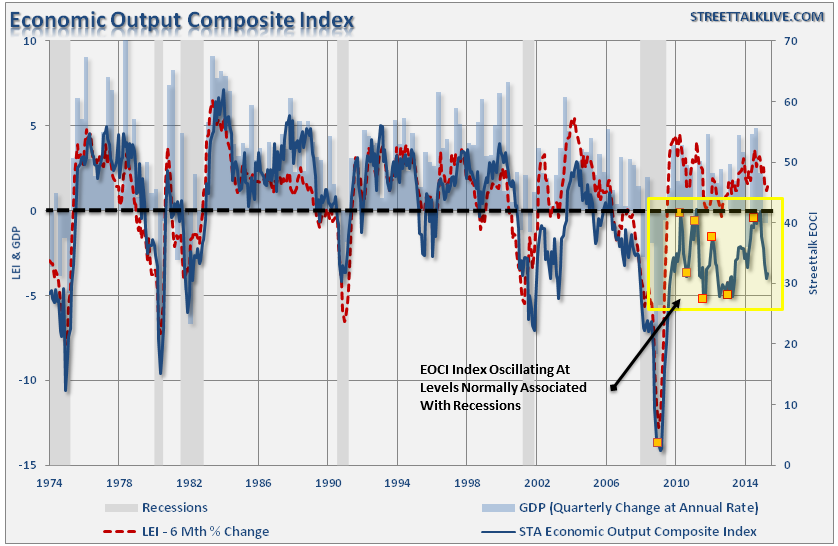
Economically speaking the story isn't getting much better as economists and bureaucrats scramble to find ways to adjust reported data to make it appear stronger than it likely is. However, the recent string of macroeconomic data points from durable and factory goods orders to retail sales, personal consumption expenditures and import/export data are all suggesting that the "real" economy is much weaker than headline statistics suggests.
This is shown clearly in the Economic Output Composite Index, which is comprised of the Chicago Fed National Activity Index (a broad measure of 85-subcomponents, the Fed regional manufacturing surveys, the NFIB survey, LEI index and the Chicago PMI. The correlation between this index and the real economic activity is very high.
Notice in the chart above the detachment of the EOCI index from the Leading Economic indicators following the financial crisis. This clearly shows what I meant earlier by reporting bureau's adjusting their reporting to obtain better results. Following the financial crisis, the Census Bureau modified the contents of the index to reflect more of the monetary influences in the economy. This has made the LEI much less reliable as an indicator of the real economy hence the detachment between real economic activity and the indicator itself.
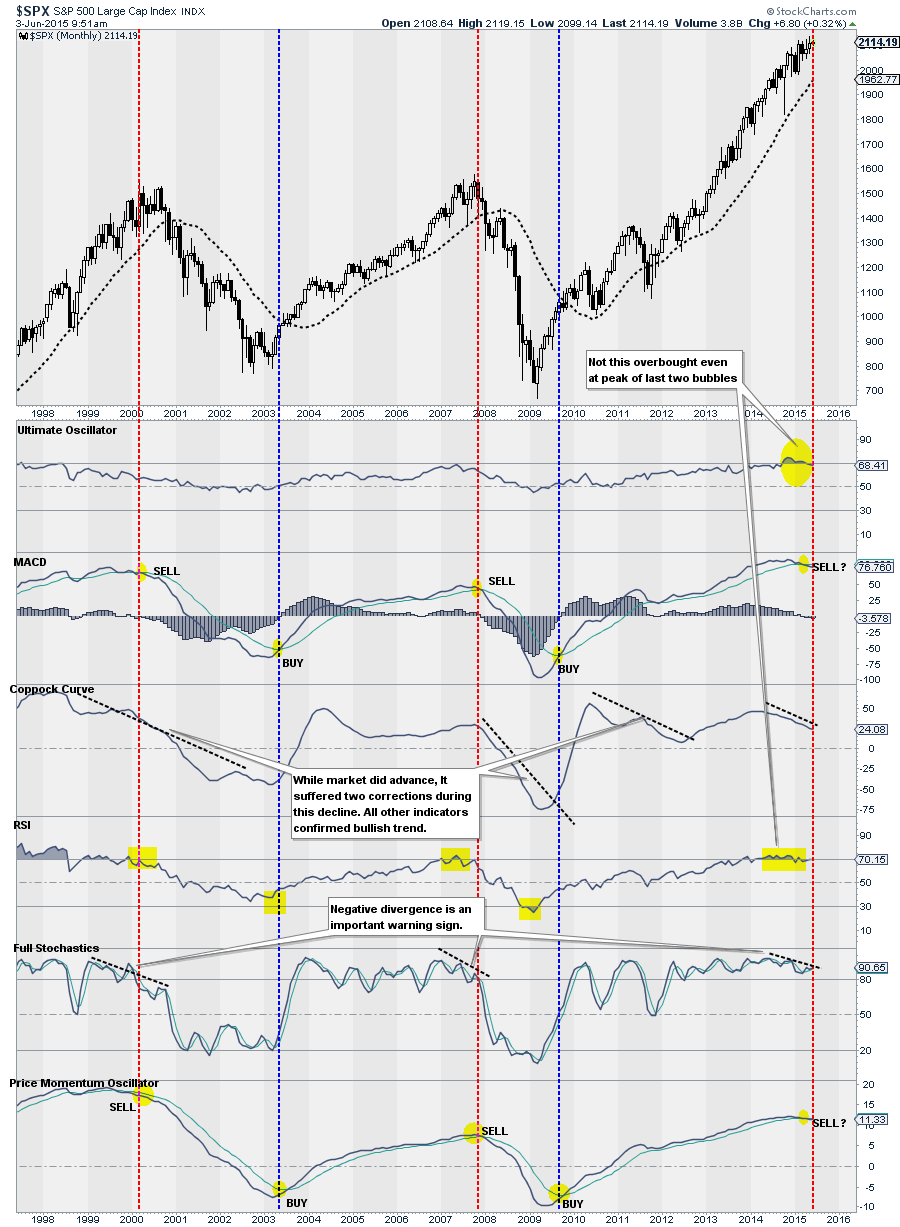
However, the real divergence is occurring within the market itself as shown in the chart below.
Currently, every single internal measure of momentum and relative strength have not only deteriorated, but are behaving in a manner that only previously existing during the last two major market peaks.
This is what I meant by using the oxymoron of the "incredibly bearish bull market."
Despite the significant number of economic, fundamental and technical data points that suggest risk has risen to elevated levels, the bullish exuberance in the market remains. This was evidenced by Jeff Saut's recent comments to Barron's, when he stated:
"...secular bull markets tend to last somewhere around 14 or 15 years. And they tend to compound at a double-digit rate. So, if we are six years into this bull market, it figures there is probably another eight or nine years left. If you compound forward at double digits, you come up with 4300 for a price objective on the S&P 500 some time in 2023 or 2024."
With that kind of outlook, and the current general belief that "there is no other alternative (TINA)" to stocks, it is ridiculous not to be currently fully invested in stocks. Right?
Of course, this was also the same attitude that existed at the peaks of the last two major bull market runs when the underlying technical breakdowns were sending out similar warnings.
While it is hoped "this time will be different," it is likely that it won't be. Importantly, none of this analysis guarantees that the markets are on the verge of the next major collapse. However, it does highly suggest that risk is currently greatly outweighing the potential reward of being aggressively invested in the markets. Considering that it has been more than 3 years since the last 10% correction, it is likely that such a correction in the near future would be the minimum expectation.
I previously wrote about "The Coming Market Meltup And 2016 Recession", which discussed the role of the Central Banks in lifting asset prices higher. However, I found this thought from Stifel Nicolaus' Barry Bannister very intriguing:
"Investors need to consider the political dimensions of possible interest rate hikes by the Federal Reserve with the approach of the 2016 elections.Given the nascent threat to its independence, we doubt the Fed wishes to cause (be blamed for) a recession in an election year."
Given the Fed's recent shuffling of stance on "data dependency" and timing or rate of interest rate increases, it certainly seems as if the Federal Reserve is allowing the markets to thrive on the glut of liquidity that currently exists.
What happens next is only a guess. However, historically, it hasn't been the outcome that investors were hoping for. But then again, maybe "bearish bull" isn't as much of an oxymoron as it is just a warning.


