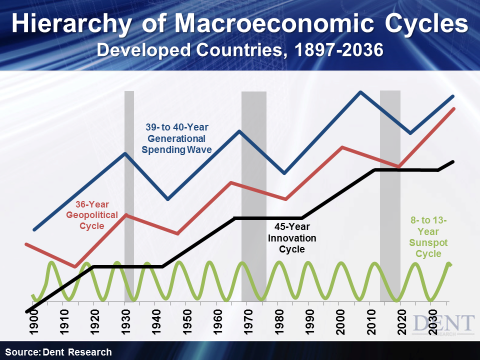
I have a hierarchy of four macroeconomic cycles that I’ve developed over the years.
I developed my first cycle in 1988, when my research culminated in the Generational spending wave, a very projectable demographic cycle spanning roughly 39 to 40 years that looks at how people spend as they age.
Since then, I’ve added a few more to my arsenal… besides the spending wave, there’s the 34- to 36-year Geopolitical Cycle, the 8- to 13-year Sunspot Cycle, and my newest, the 45-year Innovation Cycle, which together I use specifically for developed countries.
The spending wave remains at the top of my hierarchy. That’s because every generation sees a major boom and economic crisis, due in part to its own inevitable spending patterns.
But with the addition of other cycles, I’ve been able to more closely analyze major booms and busts of the past few generations.
When all four of my cycles were pointing up, we were in great periods of economic prosperity — like the tech boom in the late 1990s.
We’ve also seen some of the worst periods of economic turmoil when all four of my cycles were pointing down. Note the shaded gray areas below:

Besides the period we’re in now, there were only two times in the last century when all four cycles pointed down at the same time. These were 1930 to 1934, and 1969 to 1976.
Everyone knows about one of those periods: The Great Depression. We suffered an 89% crash in the stock market between September 1929 and July 1932. Unemployment peaked in March 1933 at 25%.
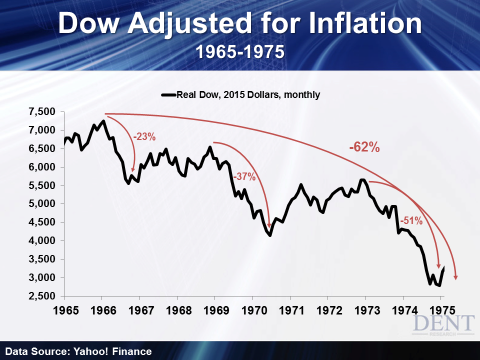
But most people are largely unaware of the 1970 stock crash, the recession that followed, and the even bigger crash of 1973 to 1974. See the chart below:

Between late 1968 and the middle of 1970, stocks crashed 37%. An even greater crash followed, starting at the beginning of 1973 and falling 51% by December 1974.
In total, from its top in late 1965 to its bottom in 1974, the Dow fell 62% adjusted for inflation… not as bad as the early 1930s, but larger than we have seen in the 2000 to 2002 and 2007 to 2008 crashes thus far — which means we’ve got a lot further to fall!
Unemployment went up from very low levels during this period, as well. It reached 6.1% in December 1970, 9% in May 1975, and finally peaked at 10.8% in December 1982.
1969 through 1982 was what I call the “summer season” — a period of high inflation mixed with recessions, or stagflation as it was called back then.
During this period, we saw a decline in the Generational spending wave as the Bob Hope generation prepared for retirement, the Innovation Cycle peak after the great auto and appliance boom, and an adverse Geopolitical Cycle that included the OPEC oil embargo, the Vietnam War, and the Cold War.
Relief finally came in 1983 as we entered the fall bubble boom and all but the Innovation Cycle turned back up again. Baby Boomers started to increase their spending, innovation climbed again on a lag, and geopolitical crises disappeared until 2001.
But all four cycles are pointing down again…
We’re now in the midst of the “winter season,” which began in 2008 and will extend out through 2022 or so. We’re coming into the center of the storm today, with all four cycles pointing down from early 2014 into early 2020.
I’ve written recently on how our artificially inflated stock bubble is destined to burst in the years to come, and how my Innovation Cycle is entering a plateau. And of course, the Baby Boomers are retiring…
But we’re also in a geopolitical downturn that started right around — you guessed it — 9/11, since when everything seems to have gone wrong! We’ve had two failed wars and one civil war after the next. Today we’re seeing Germany at loggerheads with Greece, western nations butting heads with Russia over Ukraine, and Saudi Arabia fighting for control of the Middle East against Iranian influence, a conflict currently escalating in Yemen.
Make no mistake — winter’s cold will be much more severe than summer’s heat, with greater stock crashes and much higher unemployment.
The Geopolitical Cycle won’t make a turn for the better until 2020 while the spending wave flattens out and then turns up again around 2023. Consider too that we’re approaching the most dangerous territory in the sunspot cycle into late 2016 and early 2017.
Hence, you can expect the greatest crash of your lifetime in the few short years ahead.
We keep warning people in passive retirement accounts: It’s better to get out sooner than later. The first phase of such a bubble crash can be lethal, with a 20% to 40% drop before the first bounce.
Buy-and-hold is dead! Now’s the time to get defensive and preserve your assets, leaving a portion to play the volatile swings ahead with proven trading systems.
